The following graph plots the fitted probabilities of default (y axis) depending on the credit balance (x axis) with the linear probability model (left) and the logistic model (right). Which alternative is NOT correct 500 1000 1500 2000 2500 500 1000 1500 2000 2500 Balance Balance 80 90 O zo 00 Probability of Default 90 PO zo o Probability of Detfault
The following graph plots the fitted probabilities of default (y axis) depending on the credit balance (x axis) with the linear probability model (left) and the logistic model (right). Which alternative is NOT correct 500 1000 1500 2000 2500 500 1000 1500 2000 2500 Balance Balance 80 90 O zo 00 Probability of Default 90 PO zo o Probability of Detfault

Glencoe Algebra 1, Student Edition, 9780079039897, 0079039898, 2018
18th Edition
ISBN:9780079039897
Author:Carter
Publisher:Carter
Chapter10: Statistics
Section10.1: Measures Of Center
Problem 9PPS

Related questions
Question
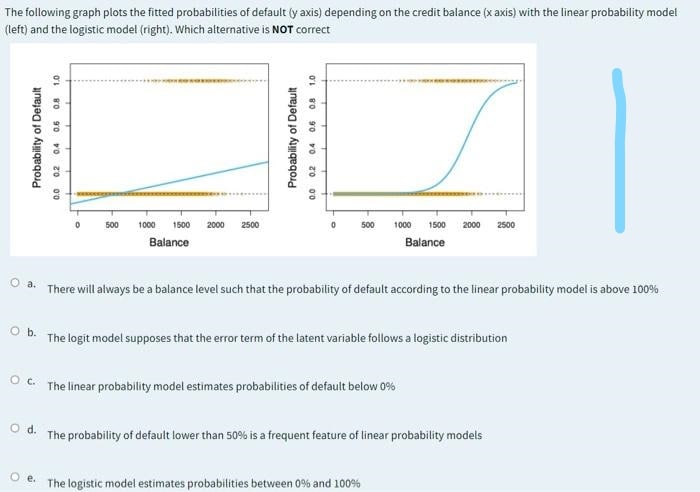
Transcribed Image Text:The following graph plots the fitted probabilities of default (y axis) depending on the credit balance (x axis) with the linear probability model
(left) and the logistic model (right). Which alternative is NOT correct
500
1000
1500
2000
2500
500
1000
1500
2000
2500
Balance
Balance
O a. There will always be a balance level such that the probability of default according to the linear probability model is above 100%
O b. The logit model supposes that the error term of the latent variable follows a logistic distribution
O C. The linear probability model estimates probabilities of default below 0%
Od.
The probability of default lower than 50% is a frequent feature of linear probability models
e.
The logistic model estimates probabilities between 0% and 100%
00
80 90 YO 0
Probability of Default
R'O 90 o zo o'o
Probability of Default
Expert Solution
This question has been solved!
Explore an expertly crafted, step-by-step solution for a thorough understanding of key concepts.

Step by step
Solved in 2 steps

Recommended textbooks for you
Glencoe Algebra 1, Student Edition, 9780079039897…
Algebra
ISBN:
9780079039897
Author:
Carter
Publisher:
McGraw Hill


Holt Mcdougal Larson Pre-algebra: Student Edition…
Algebra
ISBN:
9780547587776
Author:
HOLT MCDOUGAL
Publisher:
HOLT MCDOUGAL
Glencoe Algebra 1, Student Edition, 9780079039897…
Algebra
ISBN:
9780079039897
Author:
Carter
Publisher:
McGraw Hill
Holt Mcdougal Larson Pre-algebra: Student Edition…
Algebra
ISBN:
9780547587776
Author:
HOLT MCDOUGAL
Publisher:
HOLT MCDOUGAL