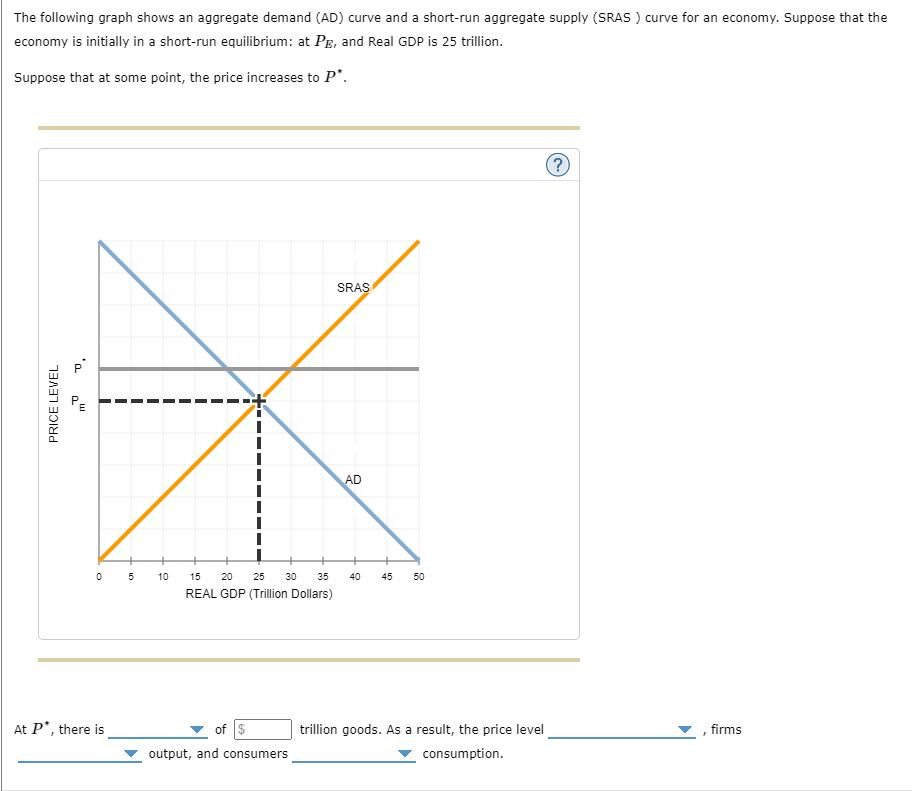
The following graph shows an aggregate demand (AD) curve and a short-run aggregate supply (SRAS) curve for an economy. Suppose that the economy is initially in a short-run equilibrium: at Pg, and Real GDP is 25 trillion. Suppose that at some point, the price increases to P*.
The following graph shows an aggregate demand (AD) curve and a short-run aggregate supply (SRAS) curve for an economy. Suppose that the economy is initially in a short-run equilibrium: at Pg, and Real GDP is 25 trillion. Suppose that at some point, the price increases to P*.

Principles of Economics (MindTap Course List)
8th Edition
ISBN:9781305585126
Author:N. Gregory Mankiw
Publisher:N. Gregory Mankiw
Chapter33: Aggregate Demand And Aggregate Supply
Section: Chapter Questions
Problem 4CQQ

Related questions
Question
Answer choices for part 1 blanks:
Blank 1: shortage, surplus
Blank 2: falls, remains the same, rises
Blank 3: decrease, do not change, increase
Blank 4: decrease, do not change, increase
There is one last part to this question that did not fit in the picture:
Suppose the economy experiences domestic goods become relatively less expensive than foreign goods. Adjust the graph to show the effect of domestic goods become relatively less expensive than foreign goods on the economy.
Which of the following best describes the effect of domestic goods become relatively less expensive than foreign goods?
a.) The price level rises back to PE, and Real GDP increases from $30 trillion to $35 trillion.
b.) The price level rises even higher above PE, and Real GDP increases from $30 trillion to $35 trillion.
c.) The price level falls even further below PE, and Real GDP decreases from $30 trillion to $35 trillion.
d.) The price level falls but remains above PE and Real GDP decreases further from $30 trillion to $35 trillion.
Transcribed Image Text:The following graph shows an aggregate demand (AD) curve and a short-run aggregate supply (SRAS) curve for an economy. Suppose that the
economy is initially in a short-run equilibrium: at Pg, and Real GDP is 25 trillion.
Suppose that at some point, the price increases to P*.
PRICE LEVEL
'a
m
0 5 10
At P*, there is
SRAS
of $
output, and consumers
AD
15
20 25 30 35 40
REAL GDP (Trillion Dollars)
145
50
trillion goods. As a result, the price level
consumption.
?
"
firms
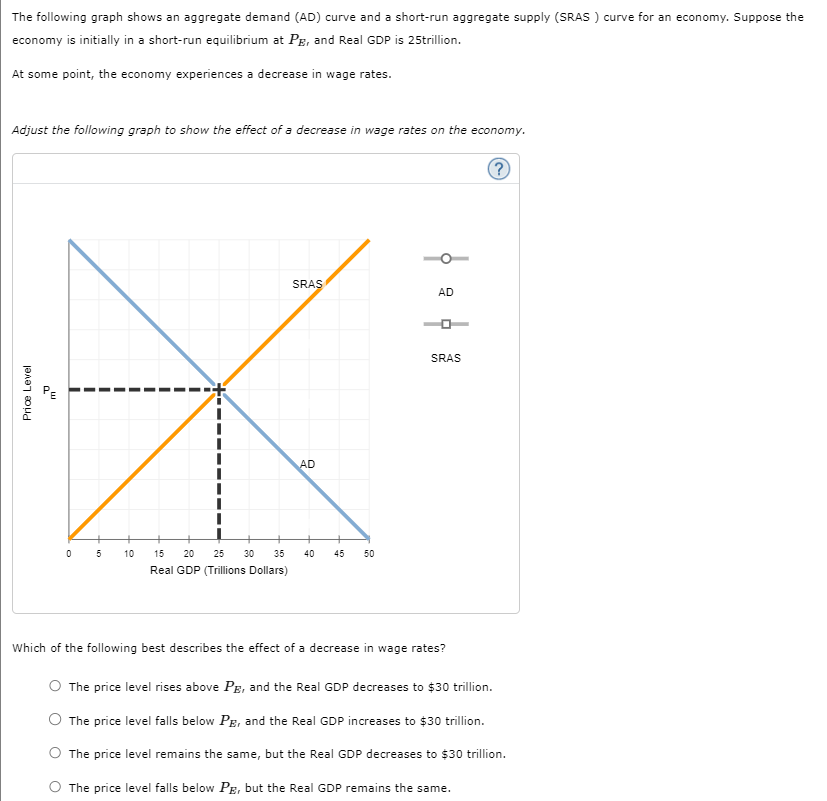
Transcribed Image Text:The following graph shows an aggregate demand (AD) curve and a short-run aggregate supply (SRAS) curve for an economy. Suppose the
economy is initially in a short-run equilibrium at Pg, and Real GDP is 25trillion.
At some point, the economy experiences a decrease in wage rates.
Adjust the following graph to show the effect of a decrease in wage rates on the economy.
?
Price Level
mu
+
0 5
10
+
15 20 25 30 35
Real GDP (Trillions Dollars)
SRAS
AD
40
45 50
AD
0
SRAS
Which of the following best describes the effect of a decrease in wage rates?
O The price level rises above Pg, and the Real GDP decreases to $30 trillion.
O The price level falls below Pg, and the Real GDP increases to $30 trillion.
O The price level remains the same, but the Real GDP decreases to $30 trillion.
The price level falls below PE, but the Real GDP remains the same.
Expert Solution
This question has been solved!
Explore an expertly crafted, step-by-step solution for a thorough understanding of key concepts.

This is a popular solution!

Trending now
This is a popular solution!

Step by step
Solved in 4 steps with 1 images

Knowledge Booster


Learn more about
Need a deep-dive on the concept behind this application? Look no further. Learn more about this topic, economics and related others by exploring similar questions and additional content below.Recommended textbooks for you
Principles of Economics (MindTap Course List)
Economics
ISBN:
9781305585126
Author:
N. Gregory Mankiw
Publisher:
Cengage Learning

Principles of Macroeconomics (MindTap Course List)
Economics
ISBN:
9781285165912
Author:
N. Gregory Mankiw
Publisher:
Cengage Learning

Brief Principles of Macroeconomics (MindTap Cours…
Economics
ISBN:
9781337091985
Author:
N. Gregory Mankiw
Publisher:
Cengage Learning
Principles of Economics (MindTap Course List)
Economics
ISBN:
9781305585126
Author:
N. Gregory Mankiw
Publisher:
Cengage Learning
Principles of Macroeconomics (MindTap Course List)
Economics
ISBN:
9781285165912
Author:
N. Gregory Mankiw
Publisher:
Cengage Learning
Brief Principles of Macroeconomics (MindTap Cours…
Economics
ISBN:
9781337091985
Author:
N. Gregory Mankiw
Publisher:
Cengage Learning

Principles of Macroeconomics (MindTap Course List)
Economics
ISBN:
9781305971509
Author:
N. Gregory Mankiw
Publisher:
Cengage Learning

Essentials of Economics (MindTap Course List)
Economics
ISBN:
9781337091992
Author:
N. Gregory Mankiw
Publisher:
Cengage Learning

Principles of Economics, 7th Edition (MindTap Cou…
Economics
ISBN:
9781285165875
Author:
N. Gregory Mankiw
Publisher:
Cengage Learning