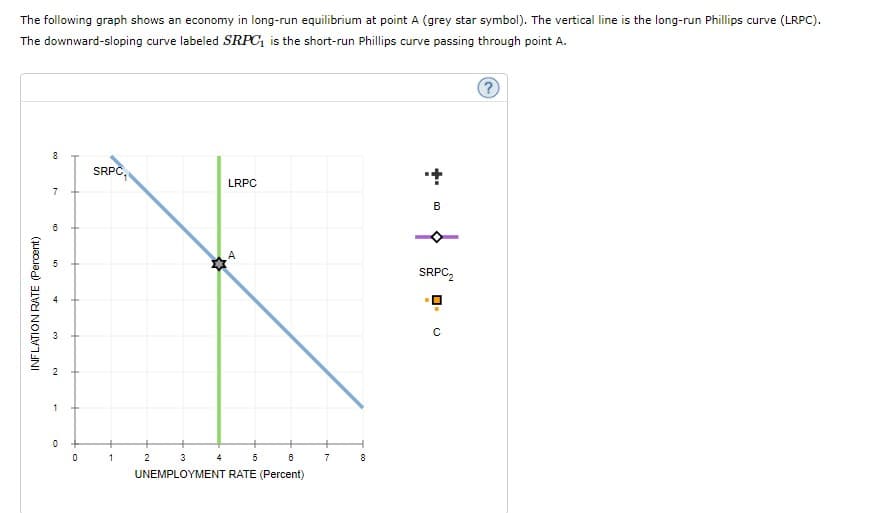
The following graph shows an economy in long-run equilibrium at point A (grey star symbol). The vertical line is the long-run Phillips curve (LRPC). The downward-sloping curve labeled SRPC, is the short-run Phillips curve passing through point A. SRPC LRPC B SRPC, 3 5 UNEMPLOYMENT RATE (Percent) 7. INFLATION RATE (Percent)
The following graph shows an economy in long-run equilibrium at point A (grey star symbol). The vertical line is the long-run Phillips curve (LRPC). The downward-sloping curve labeled SRPC, is the short-run Phillips curve passing through point A. SRPC LRPC B SRPC, 3 5 UNEMPLOYMENT RATE (Percent) 7. INFLATION RATE (Percent)

Chapter17: The Philips Curve And Expetactions Theory
Section: Chapter Questions
Problem 1SQP

Related questions
Question
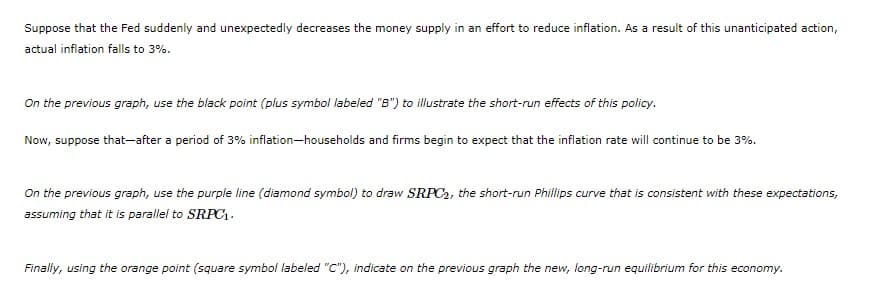
Transcribed Image Text:Suppose that the Fed suddenly and unexpectedly decreases the money supply in an effort to reduce inflation. As a result of this unanticipated action,
actual inflation falls to 3%.
On the previous graph, use the black point (plus symbol labeled "B") to illustrate the short-run effects of this policy.
Now, suppose that-after a period of 3% inflation-households and firms begin to expect that the inflation rate will continue to be 3%.
On the previous graph, use the purple line (diamond symbol) to draw SRPC2, the short-run Phillips curve that is consistent with these expectations,
assuming that it is parallel to SRPC.
Finally, using the orange point (square symbol labeled "C"), indicate on the previous graph the new, long-run equilibrium for this economy.
Transcribed Image Text:The following graph shows an economy in long-run equilibrium at point A (grey star symbol). The vertical line is the long-run Phillips curve (LRPC).
The downward-sloping curve labeled SRPC, is the short-run Phillips curve passing through point A.
SRPC,
LRPC
7
SRPC,
2
1
1
2
3
4
7
8
UNEMPLOYMENT RATE (Percent)
INFLATION RATE (Percent)
Expert Solution
This question has been solved!
Explore an expertly crafted, step-by-step solution for a thorough understanding of key concepts.

This is a popular solution!

Trending now
This is a popular solution!

Step by step
Solved in 2 steps with 2 images

Knowledge Booster


Learn more about
Need a deep-dive on the concept behind this application? Look no further. Learn more about this topic, economics and related others by exploring similar questions and additional content below.Recommended textbooks for you


Economics (MindTap Course List)
Economics
ISBN:
9781337617383
Author:
Roger A. Arnold
Publisher:
Cengage Learning

Brief Principles of Macroeconomics (MindTap Cours…
Economics
ISBN:
9781337091985
Author:
N. Gregory Mankiw
Publisher:
Cengage Learning