The following graph shows an economy's short-run aggregate supply curve (SRAS), current equilibrium aggregate price level (P₁), and real GDP ( 21). The economy currently has Natural Real GDP (ON) of $8 trillion. Use this information to place the orange long-run aggregate supply curve (LRAS, square symbols) in the correct position on the graph. PRICE LEVEL 10 0 0 2 GRAS 4 6 Q, 8 10 REAL GDP (Trillions of dollars) SRAS 12 14 The equilibrium A₁, shown on the graph, reveals that real GDP (21) is LRAS Natural Real GDP. As a result, wages will over time,
The following graph shows an economy's short-run aggregate supply curve (SRAS), current equilibrium aggregate price level (P₁), and real GDP ( 21). The economy currently has Natural Real GDP (ON) of $8 trillion. Use this information to place the orange long-run aggregate supply curve (LRAS, square symbols) in the correct position on the graph. PRICE LEVEL 10 0 0 2 GRAS 4 6 Q, 8 10 REAL GDP (Trillions of dollars) SRAS 12 14 The equilibrium A₁, shown on the graph, reveals that real GDP (21) is LRAS Natural Real GDP. As a result, wages will over time,

Chapter20: Aggregate Demand And Supply
Section20.A: The Self Correcting Aggregate Demand And Supply Model
Problem 11SQ

Related questions
Question
100%
Confused and not sure how to answer
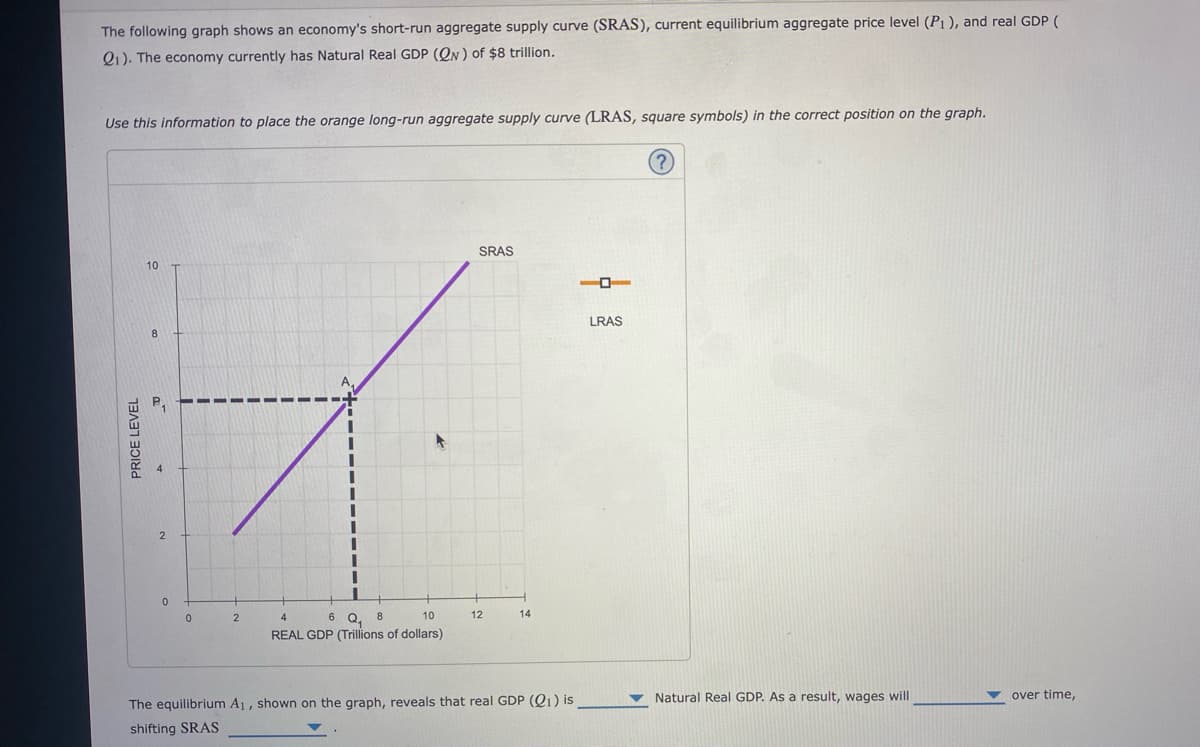
Transcribed Image Text:The following graph shows an economy's short-run aggregate supply curve (SRAS), current equilibrium aggregate price level (P₁), and real GDP (
21). The economy currently has Natural Real GDP (QN) of $8 trillion.
Use this information to place the orange long-run aggregate supply curve (LRAS, square symbols) in the correct position on the graph.
PRICE LEVEL
10
8
0
0
2
4
6 Q, 8
10
REAL GDP (Trillions of dollars)
SRAS
12
14
The equilibrium A₁, shown on the graph, reveals that real GDP (21) is
shifting SRAS
LRAS
Natural Real GDP. As a result, wages will
▼ over time,
Expert Solution
This question has been solved!
Explore an expertly crafted, step-by-step solution for a thorough understanding of key concepts.

Step by step
Solved in 2 steps with 1 images

Knowledge Booster


Learn more about
Need a deep-dive on the concept behind this application? Look no further. Learn more about this topic, economics and related others by exploring similar questions and additional content below.Recommended textbooks for you


Economics (MindTap Course List)
Economics
ISBN:
9781337617383
Author:
Roger A. Arnold
Publisher:
Cengage Learning


Survey of Economics (MindTap Course List)
Economics
ISBN:
9781305260948
Author:
Irvin B. Tucker
Publisher:
Cengage Learning