The following graph shows labor markets in the United States and Mexico. The horizontal axis denotes the total quantity of labor in each country, and the vertical axis depicts the wages paid to labor. For each country, the demand schedule for labor is represented by the value of the marginal product (VMP) of labor. Initially, the labor supply is 16 million workers, So, in the United States, and 24 million workers in Mexico, So. Suppose initially the United States and Mexico are in isolation, so that labor cannot move freely between them. United States WAGE (Dollars per worker) 20 18 16 14 12 10 0 0 Su.s.,0 Dus 48 12 16 20 24 28 28 32 32 36 40 QUANTITY OF LABOR (Millions of workers) Prior to migration, the wage rate in Mexico is (?) Mexico WAGE (Dollars per worker) 20 18 16 14 12 10 4 2 0 SMCx 0 Mex 048 12 16 20 24 28 32 36 40 QUANTITY OF LABOR (Millions of workers) the wage in the United States. ? Suppose that Mexico and the United States loosen their immigration policies so that labor can move freely between the two countries.
The following graph shows labor markets in the United States and Mexico. The horizontal axis denotes the total quantity of labor in each country, and the vertical axis depicts the wages paid to labor. For each country, the demand schedule for labor is represented by the value of the marginal product (VMP) of labor. Initially, the labor supply is 16 million workers, So, in the United States, and 24 million workers in Mexico, So. Suppose initially the United States and Mexico are in isolation, so that labor cannot move freely between them. United States WAGE (Dollars per worker) 20 18 16 14 12 10 0 0 Su.s.,0 Dus 48 12 16 20 24 28 28 32 32 36 40 QUANTITY OF LABOR (Millions of workers) Prior to migration, the wage rate in Mexico is (?) Mexico WAGE (Dollars per worker) 20 18 16 14 12 10 4 2 0 SMCx 0 Mex 048 12 16 20 24 28 32 36 40 QUANTITY OF LABOR (Millions of workers) the wage in the United States. ? Suppose that Mexico and the United States loosen their immigration policies so that labor can move freely between the two countries.

Chapter13: General Equilibrium And Welfare
Section: Chapter Questions
Problem 13.6P

Related questions
Question
Options are equal too, greater than, or less than
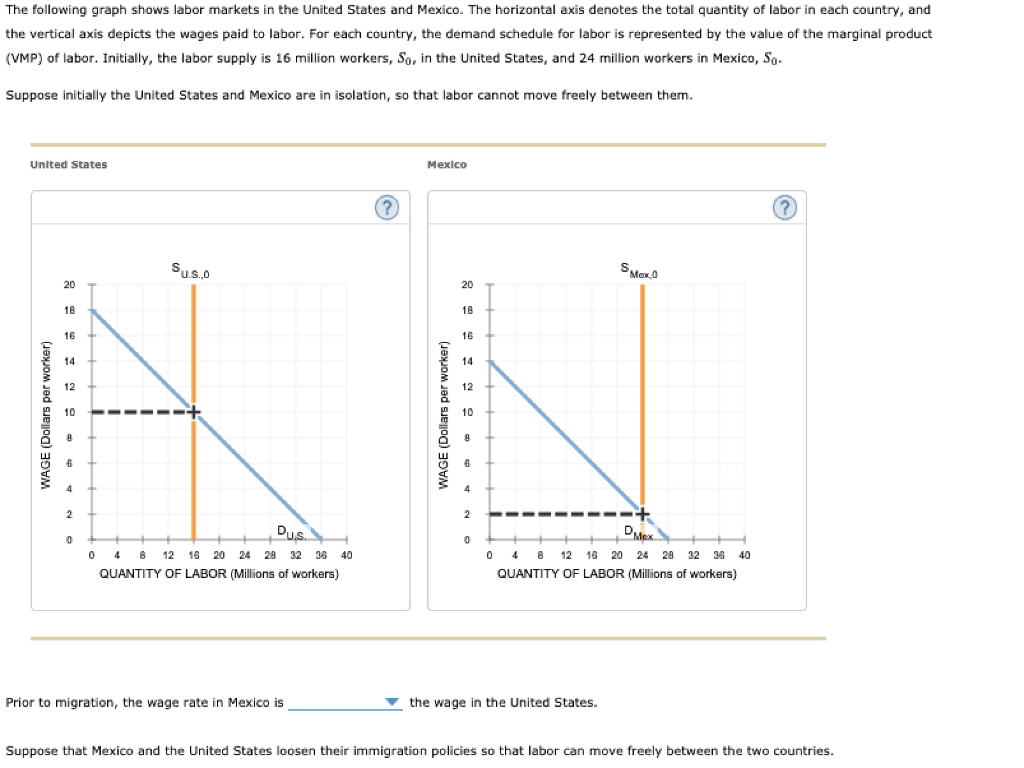
Transcribed Image Text:The following graph shows labor markets in the United States and Mexico. The horizontal axis denotes the total quantity of labor in each country, and
the vertical axis depicts the wages paid to labor. For each country, the demand schedule for labor is represented by the value of the marginal product
(VMP) of labor. Initially, the labor supply is 16 million workers, So, in the United States, and 24 million workers in Mexico, So.
Suppose initially the United States and Mexico are in isolation, so that labor cannot move freely between them.
United States
WAGE (Dollars per worker)
20
18
16
14
12
10
4
2
0
Su.s.,0
Dus.
048 12 16
16 20 24 28
32 36 40
QUANTITY OF LABOR (Millions of workers)
Prior to migration, the wage rate in Mexico is
?
Mexico
WAGE (Dollars per worker)
20
18
16
14
12
10
4
2
0
S Max.0
04 8 12 16 20 24 28 32 36 40
QUANTITY OF LABOR (Millions of workers)
the wage in the United States.
?
Suppose that Mexico and the United States loosen their immigration policies so that labor can move freely between the two countries.
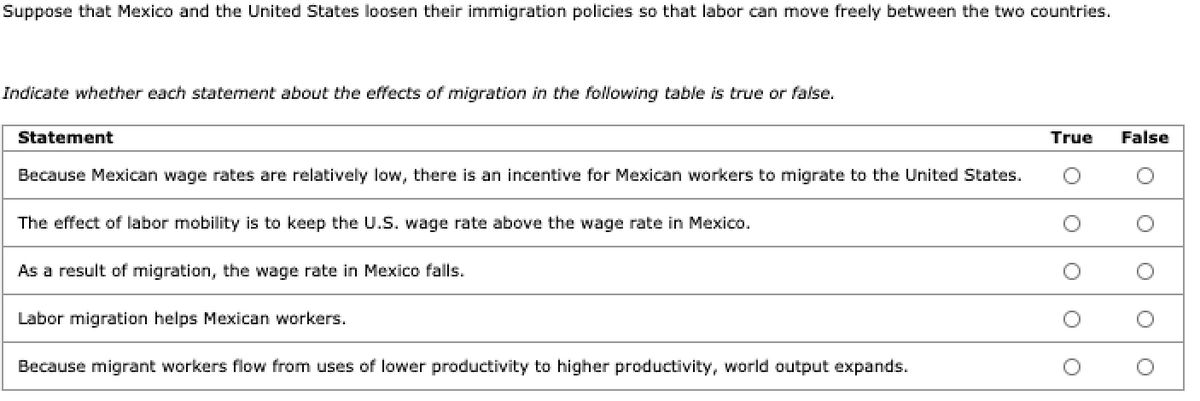
Transcribed Image Text:Suppose that Mexico and the United States loosen their immigration policies so that labor can move freely between the two countries.
Indicate whether each statement about the effects of migration in the following table is true or false.
Statement
Because Mexican wage rates are relatively low, there is an incentive for Mexican workers to migrate to the United States.
The effect of labor mobility is to keep the U.S. wage rate above the wage rate in Mexico.
As a result of migration, the wage rate in Mexico falls.
Labor migration helps Mexican workers.
Because migrant workers flow from uses of lower productivity to higher productivity, world output expands.
True False
Expert Solution
This question has been solved!
Explore an expertly crafted, step-by-step solution for a thorough understanding of key concepts.

This is a popular solution!

Trending now
This is a popular solution!

Step by step
Solved in 3 steps

Knowledge Booster


Learn more about
Need a deep-dive on the concept behind this application? Look no further. Learn more about this topic, economics and related others by exploring similar questions and additional content below.Recommended textbooks for you