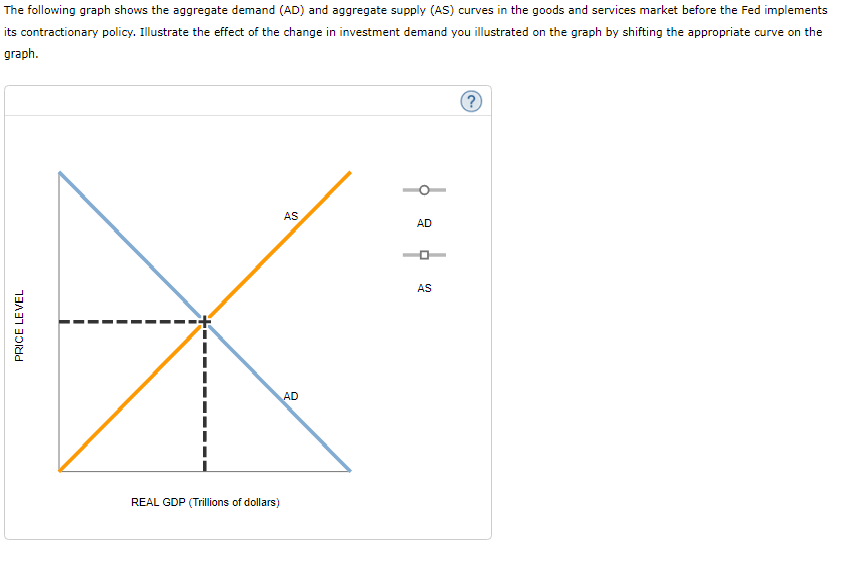
The following graph shows the aggregate demand (AD) and aggregate supply (AS) curves in the goods and services market before the Fed implements its contractionary policy. Illustrate the effect of the change in investment demand you illustrated on the graph by shifting the appropriate curve on the graph. AS AD AS AD REAL GDP (Trillions of dollars) PRICE LEVEL
The following graph shows the aggregate demand (AD) and aggregate supply (AS) curves in the goods and services market before the Fed implements its contractionary policy. Illustrate the effect of the change in investment demand you illustrated on the graph by shifting the appropriate curve on the graph. AS AD AS AD REAL GDP (Trillions of dollars) PRICE LEVEL

Chapter20: Monetary Policy
Section: Chapter Questions
Problem 12SQP

Related questions
Question
When the Fed sells bonds, the amount of money in circulation in the economy_______ . This drives interest rates_________ , which causes businesses to invest________ in capital improvements such as new factories and upgraded equipment. The result is_________ in aggregate
Transcribed Image Text:The following graph shows the aggregate demand (AD) and aggregate supply (AS) curves in the goods and services market before the Fed implements
its contractionary policy. Illustrate the effect of the change in investment demand you illustrated on the graph by shifting the appropriate curve on the
graph.
AS
AD
AS
AD
REAL GDP (Trillions of dollars)
PRICE LEVEL
Expert Solution
This question has been solved!
Explore an expertly crafted, step-by-step solution for a thorough understanding of key concepts.

This is a popular solution!

Trending now
This is a popular solution!

Step by step
Solved in 2 steps with 1 images

Knowledge Booster


Learn more about
Need a deep-dive on the concept behind this application? Look no further. Learn more about this topic, economics and related others by exploring similar questions and additional content below.Recommended textbooks for you

