The following graph shows the aggregate demand curve (AD), the short-run aggregate supply curve (A.S), and the long-run aggregate supply curve ( LRAS) for a hypothetical economy. Initially, the expected price level equals the actual price level, and the economy experiences long-run equilibrium at a natural level of output of $110 billion. Suppose a bout of severe weather drives up agricultural costs, increases the costs of transporting goods and services, and increases the costs of producing goods and services. Use the graph to help you answer the questions about the short-run and long-run effects of the increase in production costs that follow. (Note: You will not be graded on any adjustments made to the graph.) Hint: For simplicity, ignore any possible impact of the severe weather on the natural level of output.
The following graph shows the aggregate demand curve (AD), the short-run aggregate supply curve (A.S), and the long-run aggregate supply curve ( LRAS) for a hypothetical economy. Initially, the expected price level equals the actual price level, and the economy experiences long-run equilibrium at a natural level of output of $110 billion. Suppose a bout of severe weather drives up agricultural costs, increases the costs of transporting goods and services, and increases the costs of producing goods and services. Use the graph to help you answer the questions about the short-run and long-run effects of the increase in production costs that follow. (Note: You will not be graded on any adjustments made to the graph.) Hint: For simplicity, ignore any possible impact of the severe weather on the natural level of output.

Chapter20: Aggregate Demand And Supply
Section: Chapter Questions
Problem 3SQP

Related questions
Question
Blank: hyperinflation/deflation/monetary neutrality/stagflation
Please find all values and the graph.
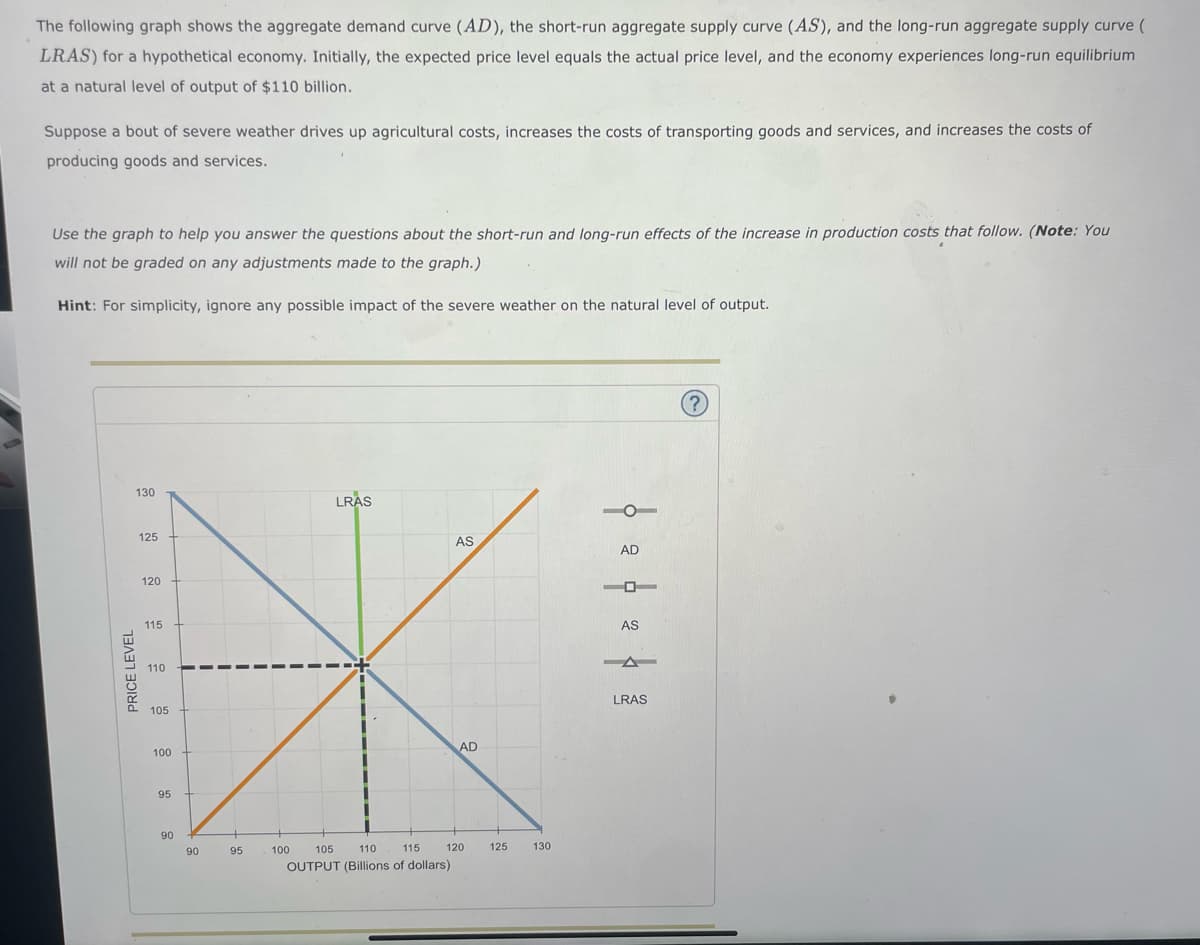
Transcribed Image Text:The following graph shows the aggregate demand curve (AD), the short-run aggregate supply curve (AS), and the long-run aggregate supply curve (
LRAS) for a hypothetical economy. Initially, the expected price level equals the actual price level, and the economy experiences long-run equilibrium
at a natural level of output of $110 billion.
Suppose a bout of severe weather drives up agricultural costs, increases the costs of transporting goods and services, and increases the costs of
producing goods and services.
Use the graph to help you answer the questions about the short-run and long-run effects of the increase in production costs that follow. (Note: You
will not be graded on any adjustments made to the graph.)
Hint: For simplicity, ignore any possible impact of the severe weather on the natural level of output.
PRICE LEVEL
130
125
120
115
110
105
100
95
90
90
95
LRAS
100
105
110 115
OUTPUT (Billions of dollars)
AS
AD
120
125
130
0
AD
- 0-
AS
LRAS
(?)
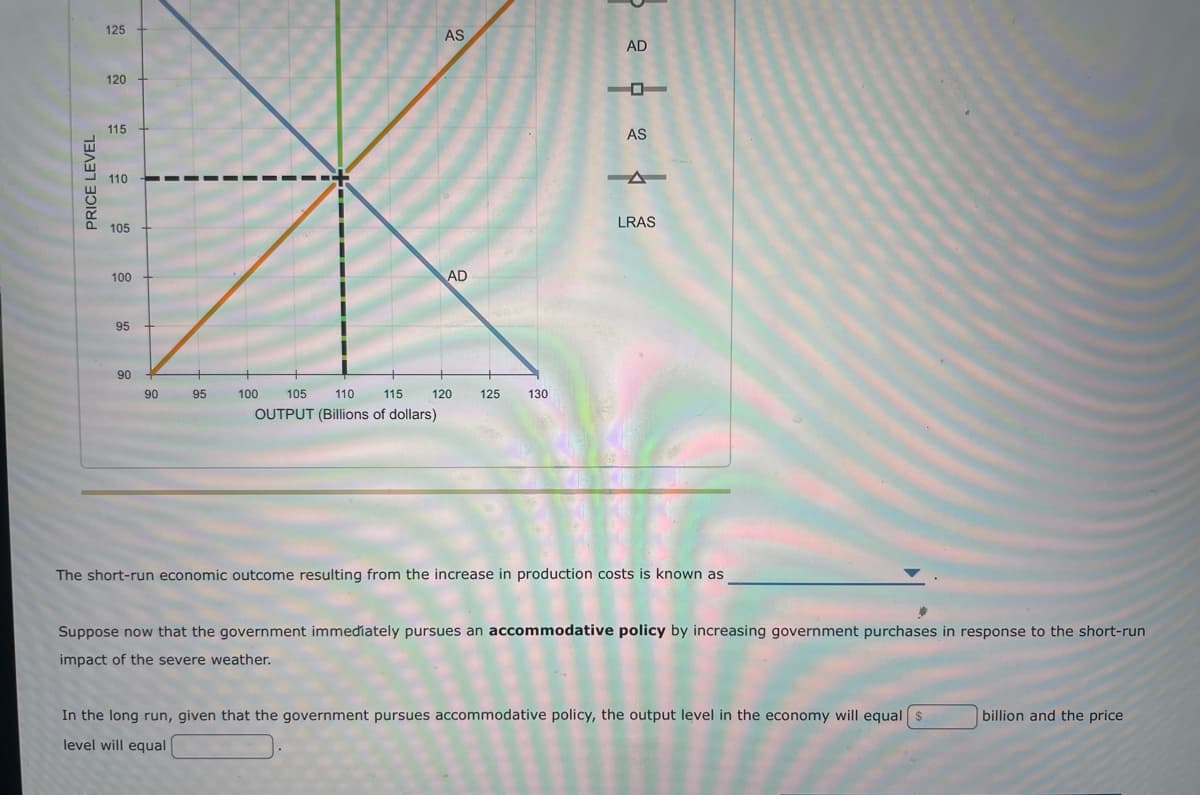
Transcribed Image Text:PRICE LEVEL
125
120
115
110
105
100
95
90
90
95
AS
AD
100 105
110 115 120 125 130
OUTPUT (Billions of dollars)
2 2 4
LRAS
The short-run economic outcome resulting from the increase in production costs is known as
Suppose now that the government immediately pursues an accommodative policy by increasing government purchases in response to the short-run
impact of the severe weather.
In the long run, given that the government pursues accommodative policy, the output level in the economy will equal $
level will equal
billion and the price
Expert Solution
This question has been solved!
Explore an expertly crafted, step-by-step solution for a thorough understanding of key concepts.

This is a popular solution!

Trending now
This is a popular solution!

Step by step
Solved in 3 steps with 1 images

Knowledge Booster


Learn more about
Need a deep-dive on the concept behind this application? Look no further. Learn more about this topic, economics and related others by exploring similar questions and additional content below.Recommended textbooks for you


Exploring Economics
Economics
ISBN:
9781544336329
Author:
Robert L. Sexton
Publisher:
SAGE Publications, Inc

Economics (MindTap Course List)
Economics
ISBN:
9781337617383
Author:
Roger A. Arnold
Publisher:
Cengage Learning
