The following graph shows the approximate value of the United States Consumer Price Index (CPI) from December 2006 through July 2007. CPI Dec 2006–July 2007 209 208 207 206 205 204 203 202 201 1 2 3 4 5 6 Dec-06 July-07 O The approximating curve shown on the figure is given by I(t) = -0.04t3 + 0.4t2 + 0.1t + 202 (0 sts 7), where t is time in months since the start of December 2006. I'(t) (a) Use the model to estimate the monthly inflation rate in June 2007 (t = 6). Recall that the inflation rate is I(t) (Round your answer to three decimal places.) (b) Was inflation slowing or speeding up in June 2007? O slowing down O speeding up (c) When was inflation speeding up? When was inflation slowing? Inflation was speeding up prior to one third of the way through ---Select--. 2007 and slowing down after that.
The following graph shows the approximate value of the United States Consumer Price Index (CPI) from December 2006 through July 2007. CPI Dec 2006–July 2007 209 208 207 206 205 204 203 202 201 1 2 3 4 5 6 Dec-06 July-07 O The approximating curve shown on the figure is given by I(t) = -0.04t3 + 0.4t2 + 0.1t + 202 (0 sts 7), where t is time in months since the start of December 2006. I'(t) (a) Use the model to estimate the monthly inflation rate in June 2007 (t = 6). Recall that the inflation rate is I(t) (Round your answer to three decimal places.) (b) Was inflation slowing or speeding up in June 2007? O slowing down O speeding up (c) When was inflation speeding up? When was inflation slowing? Inflation was speeding up prior to one third of the way through ---Select--. 2007 and slowing down after that.

Chapter7: Unemployment And Inflation
Section: Chapter Questions
Problem 3.7P

Related questions
Question
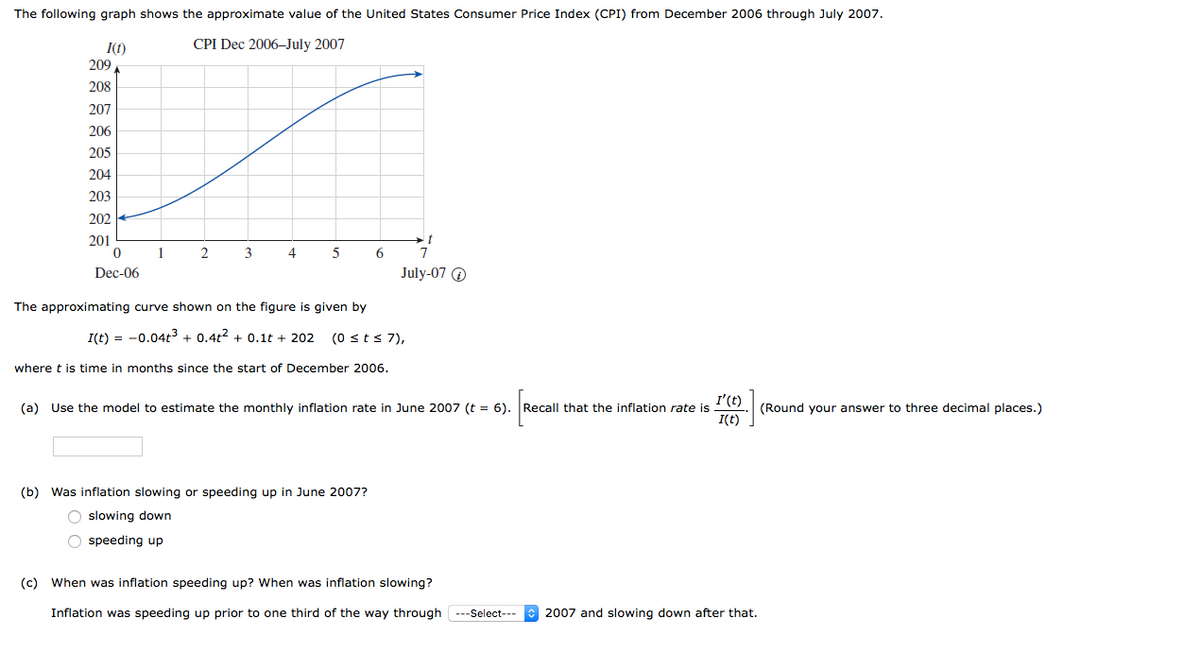
Transcribed Image Text:The following graph shows the approximate value of the United States Consumer Price Index (CPI) from December 2006 through July 2007.
I(t)
CPI Dec 2006–July 2007
209
208
207
206
205
204
203
202
201
1
3
4
5
Dec-06
July-07 O
The approximating curve shown on the figure is given by
I(t) = -0.04t3 + 0.4t2 + 0.1t + 202
(0 sts 7),
where t is time in months since the start of December 2006.
I'(t)
(a) Use the model to estimate the monthly inflation rate in June 2007 (t = 6). Recall that the inflation rate is
I(t)
(Round your answer to three decimal places.)
(b) Was inflation slowing or speeding up in June 2007?
O slowing down
O speeding up
(c) When was inflation speeding up? When was inflation slowing?
Inflation was speeding up prior to one third of the way through ---Select---
2007 and slowing down after that.
Expert Solution
This question has been solved!
Explore an expertly crafted, step-by-step solution for a thorough understanding of key concepts.

This is a popular solution!

Trending now
This is a popular solution!

Step by step
Solved in 2 steps

Knowledge Booster


Learn more about
Need a deep-dive on the concept behind this application? Look no further. Learn more about this topic, economics and related others by exploring similar questions and additional content below.Recommended textbooks for you

Macroeconomics: Principles and Policy (MindTap Co…
Economics
ISBN:
9781305280601
Author:
William J. Baumol, Alan S. Blinder
Publisher:
Cengage Learning

Macroeconomics: Principles and Policy (MindTap Co…
Economics
ISBN:
9781305280601
Author:
William J. Baumol, Alan S. Blinder
Publisher:
Cengage Learning

Principles of Economics 2e
Economics
ISBN:
9781947172364
Author:
Steven A. Greenlaw; David Shapiro
Publisher:
OpenStax

Economics (MindTap Course List)
Economics
ISBN:
9781337617383
Author:
Roger A. Arnold
Publisher:
Cengage Learning
