(1) Consumer Price Index (CPI) is a price indicator to reflect price levels over time. As a key economic indicator, CPI is computed monthly by the Bureau of Labor Statistics (BLS) using a “market basket" purchased by the typical consumer each month. Suppose you are doing a study to yearly price levels (CPI) of a metropolitan area in the US. Its CPI includes three categories, Food (grocery), Energy (gasoline) and other items (all goods and services less food and energy). The table below provides you the prices of the three categories in 2019, 2020 and 2021. Also, you have the units purchased by a typical consumer in these three categories. Use 2019 as the base year, to show step-by-step solutions for CPI in 2019, 2020 and 2021. Prices ($) and Units of selected Categories of CPI 2019 ($) Item Unit 2020 ($) 2021 ($) Food 10 6.00 5.50 6.75 Energy Other items 5 2.50 1.80 2.90 25 20.00 19.00 22.50
(1) Consumer Price Index (CPI) is a price indicator to reflect price levels over time. As a key economic indicator, CPI is computed monthly by the Bureau of Labor Statistics (BLS) using a “market basket" purchased by the typical consumer each month. Suppose you are doing a study to yearly price levels (CPI) of a metropolitan area in the US. Its CPI includes three categories, Food (grocery), Energy (gasoline) and other items (all goods and services less food and energy). The table below provides you the prices of the three categories in 2019, 2020 and 2021. Also, you have the units purchased by a typical consumer in these three categories. Use 2019 as the base year, to show step-by-step solutions for CPI in 2019, 2020 and 2021. Prices ($) and Units of selected Categories of CPI 2019 ($) Item Unit 2020 ($) 2021 ($) Food 10 6.00 5.50 6.75 Energy Other items 5 2.50 1.80 2.90 25 20.00 19.00 22.50

Principles of Microeconomics
7th Edition
ISBN:9781305156050
Author:N. Gregory Mankiw
Publisher:N. Gregory Mankiw
Chapter2: Thinking Like An Economist
Section: Chapter Questions
Problem 6PA

Related questions
Question
Completely lost please work out both parts
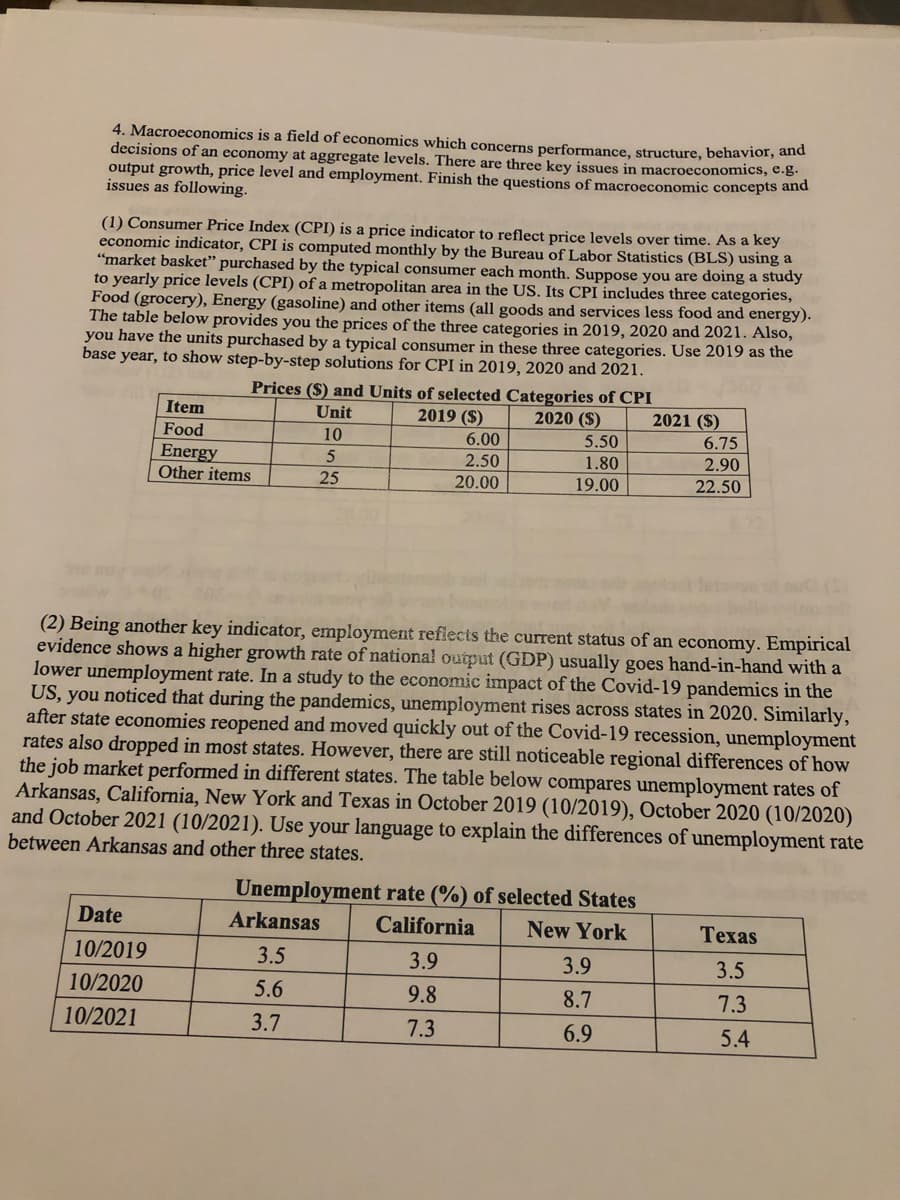
Transcribed Image Text:4. Macroeconomics is a field of economics which concerns performance, structure, behavior, and
decisions of an economy at aggregate levels. There are three key issues in macroeconomics, e.g.
output growth, price level and employment. Finish the questions of macroeconomic concepts and
issues as following.
(1) Consumer Price Index (CPI) is a price indicator to reflect price levels over time. As a key
economic indicator, CPI is computed monthly by the Bureau of Labor Statistics (BLS) using a
"market basket" purchased by the typical consumer each month. Suppose you are doing a study
to yearly price levels (CPI) of a metropolitan area in the US. Its CPI includes three categories,
Food (grocery), Energy (gasoline) and other items (all goods and services less food and energy).
The table below provides you the prices of the three categories in 2019, 2020 and 2021. Also,
you have the units purchased by a typical consumer in these three categories. Use 2019 as the
base year, to show step-by-step solutions for CPI in 2019, 2020 and 2021.
Prices ($) and Units of selected Categories of CPI
2019 ($)
Item
Unit
2020 ($)
2021 ($)
Food
10
6.00
5.50
6.75
Energy
2.50
1.80
2.90
Other items
25
20.00
19.00
22.50
(2) Being another key indicator, employment reflects the current status of an economy. Empirical
evidence shows a higher growth rate of nationa! output (GDP) usually goes hand-in-hand with a
lower unemployment rate. In a study to the economic impact of the Covid-19 pandemics in the
US, you noticed that during the pandemics, unemployment rises across states in 2020. Similarly,
after state economies reopened and moved quickly out of the Covid-19 recession, unemployment
rates also dropped in most states. However, there are still noticeable regional differences of how
the job market performed in different states. The table below compares unemployment rates of
Arkansas, California, New York and Texas in October 2019 (10/2019), October 2020 (10/2020)
and October 2021 (10/2021). Use your language to explain the differences of unemployment rate
between Arkansas and other three states.
Unemployment rate (%) of selected States
Date
Arkansas
California
New York
Техas
10/2019
3.5
3.9
3.9
3.5
10/2020
5.6
9.8
8.7
7.3
10/2021
3.7
7.3
6.9
5.4
Expert Solution
This question has been solved!
Explore an expertly crafted, step-by-step solution for a thorough understanding of key concepts.

Step by step
Solved in 3 steps with 1 images

Knowledge Booster


Learn more about
Need a deep-dive on the concept behind this application? Look no further. Learn more about this topic, economics and related others by exploring similar questions and additional content below.Recommended textbooks for you
Principles of Microeconomics
Economics
ISBN:
9781305156050
Author:
N. Gregory Mankiw
Publisher:
Cengage Learning

Essentials of Economics (MindTap Course List)
Economics
ISBN:
9781337091992
Author:
N. Gregory Mankiw
Publisher:
Cengage Learning

Brief Principles of Macroeconomics (MindTap Cours…
Economics
ISBN:
9781337091985
Author:
N. Gregory Mankiw
Publisher:
Cengage Learning
Principles of Microeconomics
Economics
ISBN:
9781305156050
Author:
N. Gregory Mankiw
Publisher:
Cengage Learning
Essentials of Economics (MindTap Course List)
Economics
ISBN:
9781337091992
Author:
N. Gregory Mankiw
Publisher:
Cengage Learning
Brief Principles of Macroeconomics (MindTap Cours…
Economics
ISBN:
9781337091985
Author:
N. Gregory Mankiw
Publisher:
Cengage Learning

Principles of Economics 2e
Economics
ISBN:
9781947172364
Author:
Steven A. Greenlaw; David Shapiro
Publisher:
OpenStax
