The following graph shows the loanable funds market in equilibrium at an interest rate of 3%. On the following graph, show the impact of the increase in government purchases on the interest rate by shifting one or both of the curves. Supply Demand Supply Demand QUANTITY OF LOANABLE FUNDS (Blons of dollars) Suppose that for each one-percentage-point increase in the interest rate, the level of investment spending declines by $1 billion. According to the change you made to the loanable funds market in the previous scenario, the increase in government purchases causes the interest rate in the money market to from 3% to . The change in the interest rate causes the level of investment spending to by bilion. After the multiplier effect is accounted for, the change in investment spending will cause the quantity of output demanded to billion at each price level. The impact of an increase in gevernment purchases on the interest rate and the level of investment spending is known as the effect. Place the purple line (diamond symbol) on the graph at the beginning of this problem to show the aggregate demand curve AD, after accounting for the impact of the increase in government purchases on the interest rate and the level of investment spending. Be sure your final aggregate demand curve (AD) is parallel to AD, and ADz. You can see the slopes of AD, and AD; by mousing over them on the graph. INTEREST RATE
The following graph shows the loanable funds market in equilibrium at an interest rate of 3%. On the following graph, show the impact of the increase in government purchases on the interest rate by shifting one or both of the curves. Supply Demand Supply Demand QUANTITY OF LOANABLE FUNDS (Blons of dollars) Suppose that for each one-percentage-point increase in the interest rate, the level of investment spending declines by $1 billion. According to the change you made to the loanable funds market in the previous scenario, the increase in government purchases causes the interest rate in the money market to from 3% to . The change in the interest rate causes the level of investment spending to by bilion. After the multiplier effect is accounted for, the change in investment spending will cause the quantity of output demanded to billion at each price level. The impact of an increase in gevernment purchases on the interest rate and the level of investment spending is known as the effect. Place the purple line (diamond symbol) on the graph at the beginning of this problem to show the aggregate demand curve AD, after accounting for the impact of the increase in government purchases on the interest rate and the level of investment spending. Be sure your final aggregate demand curve (AD) is parallel to AD, and ADz. You can see the slopes of AD, and AD; by mousing over them on the graph. INTEREST RATE

Chapter20: Exchange Rates And The Macroeconomy
Section: Chapter Questions
Problem 3TY

Related questions
Question
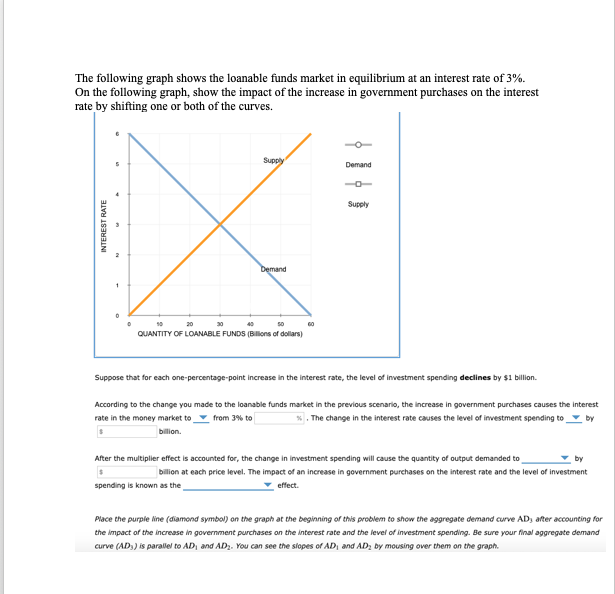
Transcribed Image Text:The following graph shows the loanable funds market in equilibrium at an interest rate of 3%.
On the following graph, show the impact of the increase in government purchases on the interest
rate by shifting one or both of the curves.
Supply
Demand
Supply
Demand
10
20
QUANTITY OF LOANABLE FUNDS (BIllons of dollars)
Suppose that for each one-percentage-point increase in the interest rate, the level of investment spending declines by $1 billion.
According to the change you made to the loanable funds market in the previous scenario, the increase in government purchases causes the interest
rate in the money market to from 3% to
The change in the interest rate causes the level of investment spending to by
bilion.
After the multiplier effect is accounted for, the change in investment spending will cause the quantity of output demanded to
by
bilion at each price level. The impact of an increase in government purchases on the interest rate and the level of investment
spending is known as the
effect.
Place the purple line (diamond symbol) on the graph at the beginning of this problem to show the aggregate demand curve AD, after accounting for
the impact of the increase in government purchases on the interest rate and the level of investment spending. Be sure your final aggregate demand
curve (AD,) is parallel to AD, and ADz. You can see the slopes of AD, and AD, by mousing over them on the graph.
INTEREST RATE
Expert Solution
This question has been solved!
Explore an expertly crafted, step-by-step solution for a thorough understanding of key concepts.

This is a popular solution!

Trending now
This is a popular solution!

Step by step
Solved in 3 steps with 2 images

Knowledge Booster


Learn more about
Need a deep-dive on the concept behind this application? Look no further. Learn more about this topic, economics and related others by exploring similar questions and additional content below.Recommended textbooks for you


Principles of Economics 2e
Economics
ISBN:
9781947172364
Author:
Steven A. Greenlaw; David Shapiro
Publisher:
OpenStax
Principles of Economics 2e
Economics
ISBN:
9781947172364
Author:
Steven A. Greenlaw; David Shapiro
Publisher:
OpenStax