The following graph shows the market demand for new homes in a local community. Suppose that a recent increase in the crime rate reduces the rate at which new families move into the town. Show the impact of the crime wave by shifting the demand curve on the following graph.
The following graph shows the market demand for new homes in a local community. Suppose that a recent increase in the crime rate reduces the rate at which new families move into the town. Show the impact of the crime wave by shifting the demand curve on the following graph.

Essentials of Economics (MindTap Course List)
8th Edition
ISBN:9781337091992
Author:N. Gregory Mankiw
Publisher:N. Gregory Mankiw
Chapter4: The Market Forces Of Supply And Demand
Section4.2: Demand
Problem 2QQ

Related questions
Question
The following graph shows the market demand for new homes in a local community. Suppose that a recent increase in the crime rate reduces the rate at which new families move into the town.
Show the impact of the crime wave by shifting the demand curve on the following graph.
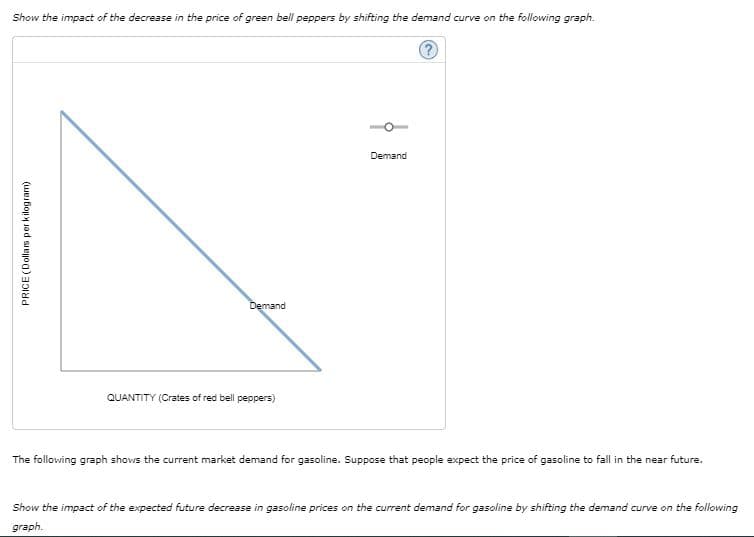
Transcribed Image Text:Show the impact of the decrease in the price of green bell peppers by shifting the demand curve on the following graph.
Demand
Demand
QUANTITY (Crates of red bell peppers)
The following graph shows the current market demand for gasoline. Suppose that people expect the price of gasoline to fall in the near future.
Show the impact of the expected future decrease in gasoline prices on the current demand for gasoline by shifting the demand curve on the following
graph.
PRICE (Dollas per kilogram)
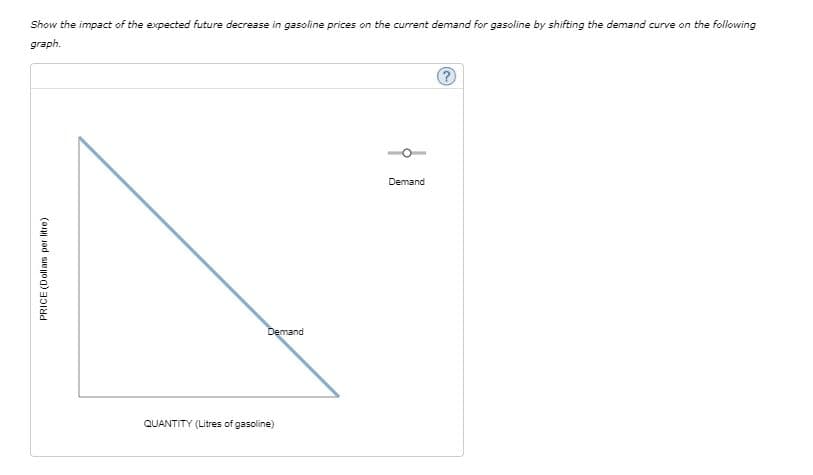
Transcribed Image Text:Show the impact of the expected future decrease in gasoline prices on the current demand for gasoline by shifting the demand curve on the following
graph.
Demand
Demand
QUANTITY (Litres of gasoline)
PRICE (Dollars per litre)
Expert Solution
This question has been solved!
Explore an expertly crafted, step-by-step solution for a thorough understanding of key concepts.

This is a popular solution!

Trending now
This is a popular solution!

Step by step
Solved in 2 steps with 3 images

Recommended textbooks for you
Essentials of Economics (MindTap Course List)
Economics
ISBN:
9781337091992
Author:
N. Gregory Mankiw
Publisher:
Cengage Learning

Brief Principles of Macroeconomics (MindTap Cours…
Economics
ISBN:
9781337091985
Author:
N. Gregory Mankiw
Publisher:
Cengage Learning

Exploring Economics
Economics
ISBN:
9781544336329
Author:
Robert L. Sexton
Publisher:
SAGE Publications, Inc
Essentials of Economics (MindTap Course List)
Economics
ISBN:
9781337091992
Author:
N. Gregory Mankiw
Publisher:
Cengage Learning
Brief Principles of Macroeconomics (MindTap Cours…
Economics
ISBN:
9781337091985
Author:
N. Gregory Mankiw
Publisher:
Cengage Learning
Exploring Economics
Economics
ISBN:
9781544336329
Author:
Robert L. Sexton
Publisher:
SAGE Publications, Inc


