The following graph shows the market for wheat in Canada, where Dc is the demand curve, Sc is the supply curve, and Pw is the free trade price of wheat. Assume that Canada is a relatively small producer of wheat, so changes in its output do not affect the world price of wheat. Also assume that Canada is currently open to free trade, and domestic consumers are able to purchase wheat at the world price with negligible transportation costs. Suppose a subsidy of $80 per ton is granted to exporters in Canada, allowing them to sell their products abroad at prices below their costs. Assume that trade restrictions are also put in place in order to prevent domestic consumers from buying wheat abroad at the world price. Use the grey line (star symbols) to indicate the world price of wheat plus the subsidy on the following graph. Then use the black point (plus symbol) to indicate the price of wheat in Canada and the quantity demanded at that price. Finally, use the tan point (dash symbol) to indicate the price of wheat received by Canadian producers with the subsidy and the quantity of wheat they will supply at that price. PRICE (Dollars per ton) 400 300 320 200 240 200 160 120 BO 40 0 0 Do 100 200 300 400 500 600 700 800 900 1000 QUANTITY (Tons) P+ Subsidy Qin Canada Q, in Canada Loss in CS Gain in PS
The following graph shows the market for wheat in Canada, where Dc is the demand curve, Sc is the supply curve, and Pw is the free trade price of wheat. Assume that Canada is a relatively small producer of wheat, so changes in its output do not affect the world price of wheat. Also assume that Canada is currently open to free trade, and domestic consumers are able to purchase wheat at the world price with negligible transportation costs. Suppose a subsidy of $80 per ton is granted to exporters in Canada, allowing them to sell their products abroad at prices below their costs. Assume that trade restrictions are also put in place in order to prevent domestic consumers from buying wheat abroad at the world price. Use the grey line (star symbols) to indicate the world price of wheat plus the subsidy on the following graph. Then use the black point (plus symbol) to indicate the price of wheat in Canada and the quantity demanded at that price. Finally, use the tan point (dash symbol) to indicate the price of wheat received by Canadian producers with the subsidy and the quantity of wheat they will supply at that price. PRICE (Dollars per ton) 400 300 320 200 240 200 160 120 BO 40 0 0 Do 100 200 300 400 500 600 700 800 900 1000 QUANTITY (Tons) P+ Subsidy Qin Canada Q, in Canada Loss in CS Gain in PS

Principles of Microeconomics
7th Edition
ISBN:9781305156050
Author:N. Gregory Mankiw
Publisher:N. Gregory Mankiw
Chapter9: Application: International Trade
Section: Chapter Questions
Problem 8PA

Related questions
Question
all one question, full question included. no information is missing
Note:-
- Do not provide handwritten solution. Maintain accuracy and quality in your answer. Take care of plagiarism.
- Answer completely.
- You will get up vote for sure.
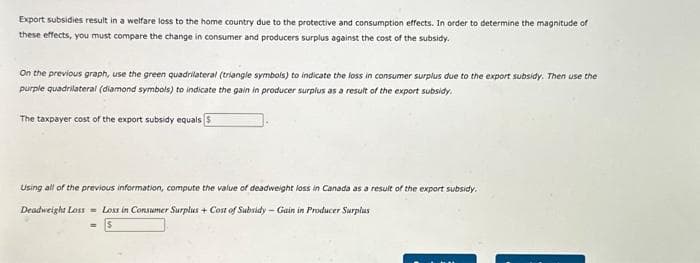
Transcribed Image Text:Export subsidies result in a welfare loss to the home country due to the protective and consumption effects. In order to determine the magnitude of
these effects, you must compare the change in consumer and producers surplus against the cost of the subsidy.
On the previous graph, use the green quadrilateral (triangle symbols) to indicate the loss in consumer surplus due to the export subsidy. Then use the
purple quadrilateral (diamond symbols) to indicate the gain in producer surplus as a result of the export subsidy.
The taxpayer cost of the export subsidy equals S
Using all of the previous information, compute the value of deadweight loss in Canada as a result of the export subsidy.
Deadweight Loss Loss in Consumer Surplus + Cost of Subsidy-Gain in Producer Surplus
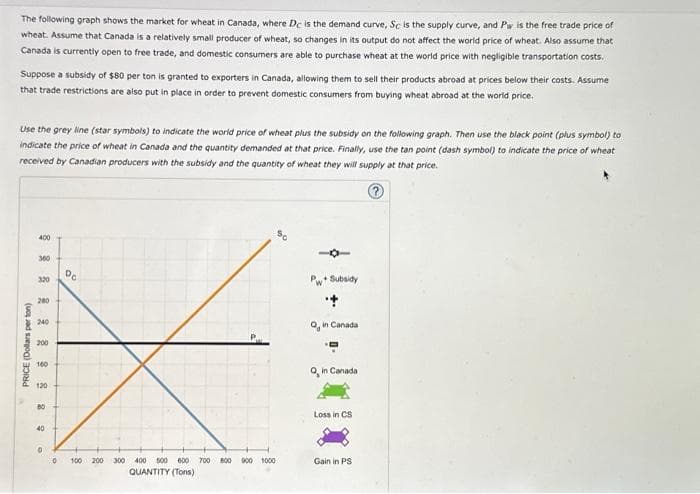
Transcribed Image Text:The following graph shows the market for wheat in Canada, where Dc is the demand curve, Sc is the supply curve, and Pw is the free trade price of
wheat. Assume that Canada is a relatively small producer of wheat, so changes in its output do not affect the world price of wheat. Also assume that
Canada is currently open to free trade, and domestic consumers are able to purchase wheat at the world price with negligible transportation costs.
Suppose a subsidy of $80 per ton is granted to exporters in Canada, allowing them to sell their products abroad at prices below their costs. Assume
that trade restrictions are also put in place in order to prevent domestic consumers from buying wheat abroad at the world price.
Use the grey line (star symbols) to indicate the world price of wheat plus the subsidy on the following graph. Then use the black point (plus symbol) to
indicate the price of wheat in Canada and the quantity demanded at that price. Finally, use the tan point (dash symbol) to indicate the price of wheat
received by Canadian producers with the subsidy and the quantity of wheat they will supply at that price.
PRICE (Dollars perton)
400
300
320
200
240
200
160
120
BO
40
0
Do
0 100 200
300 400 500 600 700 800 900 1000
QUANTITY (Tons)
Pw+ Subsidy
+
in Canada
Qin Canada
Loss in CS
Gain in PS
Expert Solution
This question has been solved!
Explore an expertly crafted, step-by-step solution for a thorough understanding of key concepts.

This is a popular solution!

Trending now
This is a popular solution!

Step by step
Solved in 4 steps with 2 images

Knowledge Booster


Learn more about
Need a deep-dive on the concept behind this application? Look no further. Learn more about this topic, economics and related others by exploring similar questions and additional content below.Recommended textbooks for you
Principles of Microeconomics
Economics
ISBN:
9781305156050
Author:
N. Gregory Mankiw
Publisher:
Cengage Learning

Principles of Economics, 7th Edition (MindTap Cou…
Economics
ISBN:
9781285165875
Author:
N. Gregory Mankiw
Publisher:
Cengage Learning

Principles of Macroeconomics (MindTap Course List)
Economics
ISBN:
9781285165912
Author:
N. Gregory Mankiw
Publisher:
Cengage Learning
Principles of Microeconomics
Economics
ISBN:
9781305156050
Author:
N. Gregory Mankiw
Publisher:
Cengage Learning
Principles of Economics, 7th Edition (MindTap Cou…
Economics
ISBN:
9781285165875
Author:
N. Gregory Mankiw
Publisher:
Cengage Learning
Principles of Macroeconomics (MindTap Course List)
Economics
ISBN:
9781285165912
Author:
N. Gregory Mankiw
Publisher:
Cengage Learning

Economics (MindTap Course List)
Economics
ISBN:
9781337617383
Author:
Roger A. Arnold
Publisher:
Cengage Learning

