The following graph shows the planned expenditure line (AE) for an economy where current equilibrium income is $400 billion and full-employment income is $650 billion. (? 800 45-degree line 700 PE 600 PE 500 400 300 200 100 Full-Employment Income 100 200 300 400 500 600 700 800 INCOME (Billions of dollars) The economy is experiencing v with the absolute value of the gap equal to $ billion. Closing the income gap would require a $ billion in government spending. Thus the value of the multiplier for this economy is REAL EXPENDIT URE (Billions of dollars)
The following graph shows the planned expenditure line (AE) for an economy where current equilibrium income is $400 billion and full-employment income is $650 billion. (? 800 45-degree line 700 PE 600 PE 500 400 300 200 100 Full-Employment Income 100 200 300 400 500 600 700 800 INCOME (Billions of dollars) The economy is experiencing v with the absolute value of the gap equal to $ billion. Closing the income gap would require a $ billion in government spending. Thus the value of the multiplier for this economy is REAL EXPENDIT URE (Billions of dollars)

Brief Principles of Macroeconomics (MindTap Course List)
8th Edition
ISBN:9781337091985
Author:N. Gregory Mankiw
Publisher:N. Gregory Mankiw
Chapter7: Production And Growth
Section: Chapter Questions
Problem 5CQQ

Related questions
Question
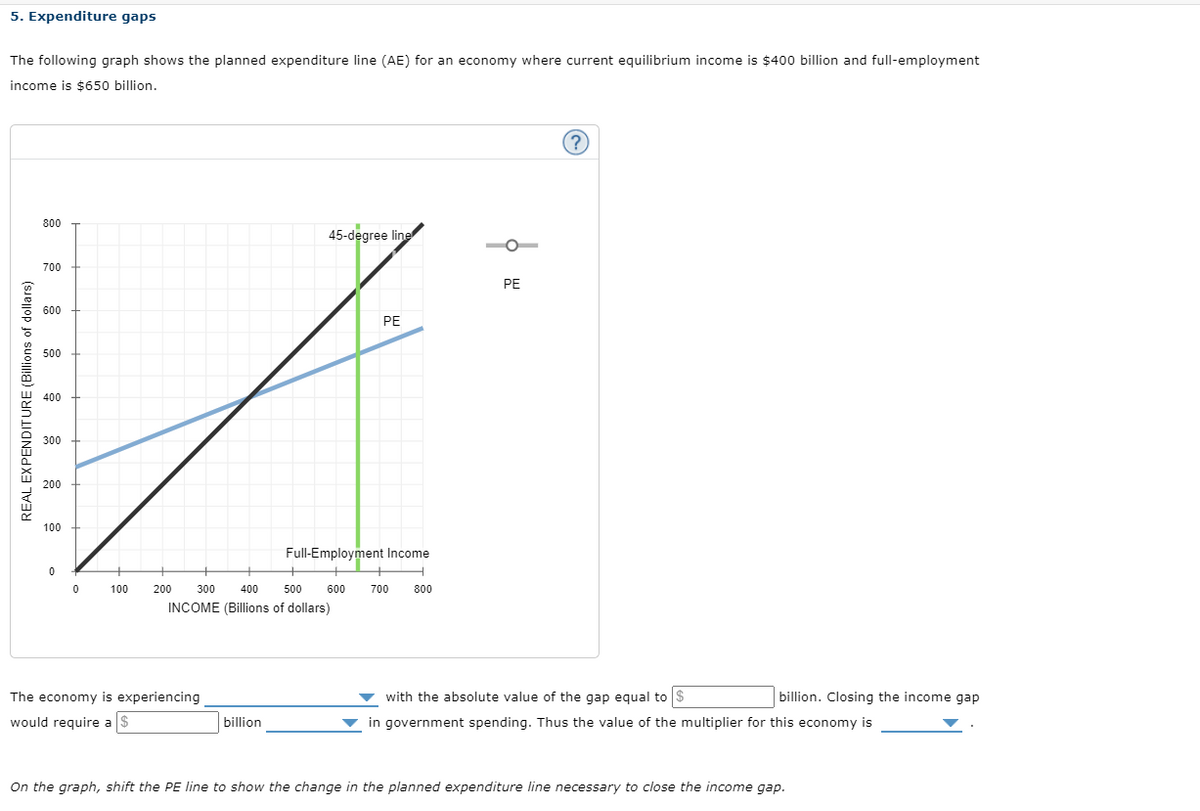
Transcribed Image Text:5. Expenditure gaps
The following graph shows the planned expenditure line (AE) for an economy where current equilibrium income is $400 billion and full-employment
income is $650 billion.
800
45-degree line
700
PE
600
PE
500
400
300
200
100
Full-Employment Income
100
200
300
400
500
600
700
800
INCOME (Billions of dollars)
The economy is experiencing
with the absolute value of the gap equal to $
billion. Closing the income gap
would require a $
billion
in government spending. Thus the value of the multiplier for this economy is
On the graph, shift the PE line to show the change in the planned expenditure line necessary to close the income gap.
REAL EXPENDIT URE (Billions of dollars)
Expert Solution
This question has been solved!
Explore an expertly crafted, step-by-step solution for a thorough understanding of key concepts.

This is a popular solution!

Trending now
This is a popular solution!

Step by step
Solved in 2 steps with 1 images

Knowledge Booster


Learn more about
Need a deep-dive on the concept behind this application? Look no further. Learn more about this topic, economics and related others by exploring similar questions and additional content below.Recommended textbooks for you
Brief Principles of Macroeconomics (MindTap Cours…
Economics
ISBN:
9781337091985
Author:
N. Gregory Mankiw
Publisher:
Cengage Learning

Principles of Economics 2e
Economics
ISBN:
9781947172364
Author:
Steven A. Greenlaw; David Shapiro
Publisher:
OpenStax

Brief Principles of Macroeconomics (MindTap Cours…
Economics
ISBN:
9781337091985
Author:
N. Gregory Mankiw
Publisher:
Cengage Learning
Principles of Economics 2e
Economics
ISBN:
9781947172364
Author:
Steven A. Greenlaw; David Shapiro
Publisher:
OpenStax
