The following graph shows the production possibilities curve (also known as the production possibilities frontier) of an economy that produces cars and computers. Suppose that a fall in this economy's saving rate results in a low level of private investment. Manufacturing plants crumble and aren't repaired, and output drops. Adjust the production possibilities curve (PPC) to show the economy's new production possibilities after the fall in the saving rate. Note: Select either end of the curve on the graph to make the endpoints appear. Then drag one or both endpoints to the desired position. Points will snap into position, so if you try to move a point and it snaps back to its original position, just drag it a little farther. QUANTITY OF CARS (Millions) 24 PPC 10 QUANTITY OF COMPUTERS (Millions) 15 PPC Suppose society faces a broad tradeoff between allocating resources to the production of investment goods (computers) and consumption goods (cars) before the fall in the saving rate described above. Which of the following events would be most likely to lead to the fall in the saving rate you just illustrated? Decreasing production of investment and consumption goods Decreasing production of investment goods and increasing production of consumption goods O Increasing production of investment goods and decreasing production of consumption goods Increasing production of investment and consumption goods
The following graph shows the production possibilities curve (also known as the production possibilities frontier) of an economy that produces cars and computers. Suppose that a fall in this economy's saving rate results in a low level of private investment. Manufacturing plants crumble and aren't repaired, and output drops. Adjust the production possibilities curve (PPC) to show the economy's new production possibilities after the fall in the saving rate. Note: Select either end of the curve on the graph to make the endpoints appear. Then drag one or both endpoints to the desired position. Points will snap into position, so if you try to move a point and it snaps back to its original position, just drag it a little farther. QUANTITY OF CARS (Millions) 24 PPC 10 QUANTITY OF COMPUTERS (Millions) 15 PPC Suppose society faces a broad tradeoff between allocating resources to the production of investment goods (computers) and consumption goods (cars) before the fall in the saving rate described above. Which of the following events would be most likely to lead to the fall in the saving rate you just illustrated? Decreasing production of investment and consumption goods Decreasing production of investment goods and increasing production of consumption goods O Increasing production of investment goods and decreasing production of consumption goods Increasing production of investment and consumption goods

Chapter2: Productions Possibilities, Opportunity Costs, And Economic Growth
Section: Chapter Questions
Problem 14SQ

Related questions
Question
76
Transcribed Image Text:The following graph shows the production possibilities curve (also known as the production possibilities frontier) of an economy that produces cars and
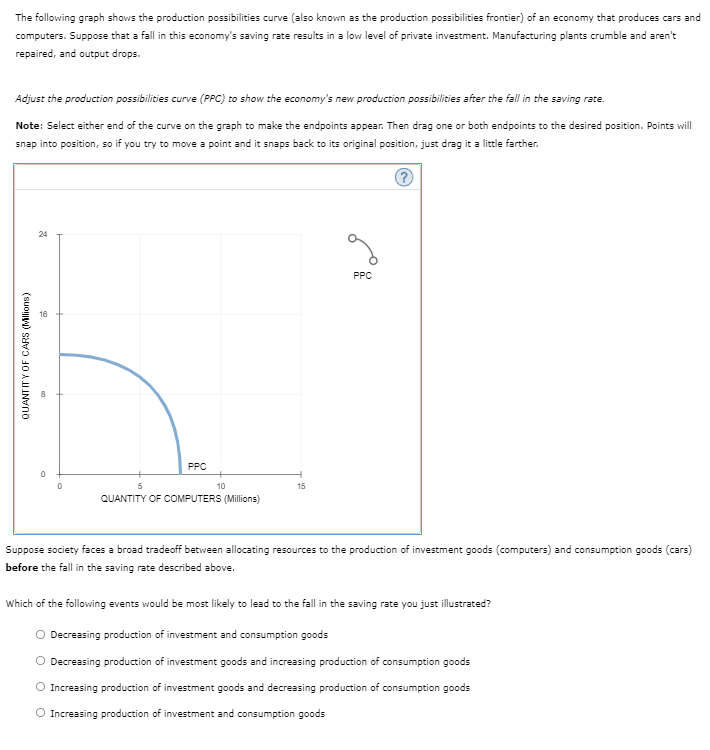
computers. Suppose that a fall in this economy's saving rate results in a low level of private investment. Manufacturing plants crumble and aren't
repaired, and output drops.
Adjust the production possibilities curve (PPC) to show the economy's new production possibilities after the fall in the saving rate.
Note: Select either end of the curve on the graph to make the endpoints appear. Then drag one or both endpoints to the desired position. Points will
snap into position, so if you try to move a point and it snaps back to its original position, just drag it a little farther.
QUANTITY OF CARS (Millions)
24
16
0
0
PPC
10
QUANTITY OF COMPUTERS (Millions)
15
g
PPC
Suppose society faces a broad tradeoff between allocating resources to the production of investment goods (computers) and consumption goods (cars)
before the fall in the saving rate described above.
Which of the following events would be most likely to lead to the fall in the saving rate you just illustrated?
O Decreasing production of investment and consumption goods
Decreasing production of investment goods and increasing production of consumption goods
O Increasing production of investment goods and decreasing production of consumption goods
O Increasing production of investment and consumption goods
Expert Solution
This question has been solved!
Explore an expertly crafted, step-by-step solution for a thorough understanding of key concepts.

This is a popular solution!

Trending now
This is a popular solution!

Step by step
Solved in 2 steps with 1 images

Knowledge Booster


Learn more about
Need a deep-dive on the concept behind this application? Look no further. Learn more about this topic, economics and related others by exploring similar questions and additional content below.Recommended textbooks for you


Economics Today and Tomorrow, Student Edition
Economics
ISBN:
9780078747663
Author:
McGraw-Hill
Publisher:
Glencoe/McGraw-Hill School Pub Co

Survey of Economics (MindTap Course List)
Economics
ISBN:
9781305260948
Author:
Irvin B. Tucker
Publisher:
Cengage Learning