The following graph shows the total expenditure line (TE) for an economy where current equilibrium output is $350 billion and potential output is $600 billion. The economy is experiencing _________ (a contractionary gap, an inflationary gap) equal to $______ billion. To close the output gap, government purchases could _______ (increase, decrease) by _____ ($50, 150, 75) billion. Thus, the value of the multiplier for this economy is ___________ (0.7143, 0.5833, 0.4167, 1.6667, 0.6).
The following graph shows the total expenditure line (TE) for an economy where current equilibrium output is $350 billion and potential output is $600 billion. The economy is experiencing _________ (a contractionary gap, an inflationary gap) equal to $______ billion. To close the output gap, government purchases could _______ (increase, decrease) by _____ ($50, 150, 75) billion. Thus, the value of the multiplier for this economy is ___________ (0.7143, 0.5833, 0.4167, 1.6667, 0.6).

Chapter9: Demand-side Equilibrium: Unemployment Or Inflation?
Section9.A: The Simple Algebra Of Income Determination And The Multiplier
Problem 4TY

Related questions
Question
100%
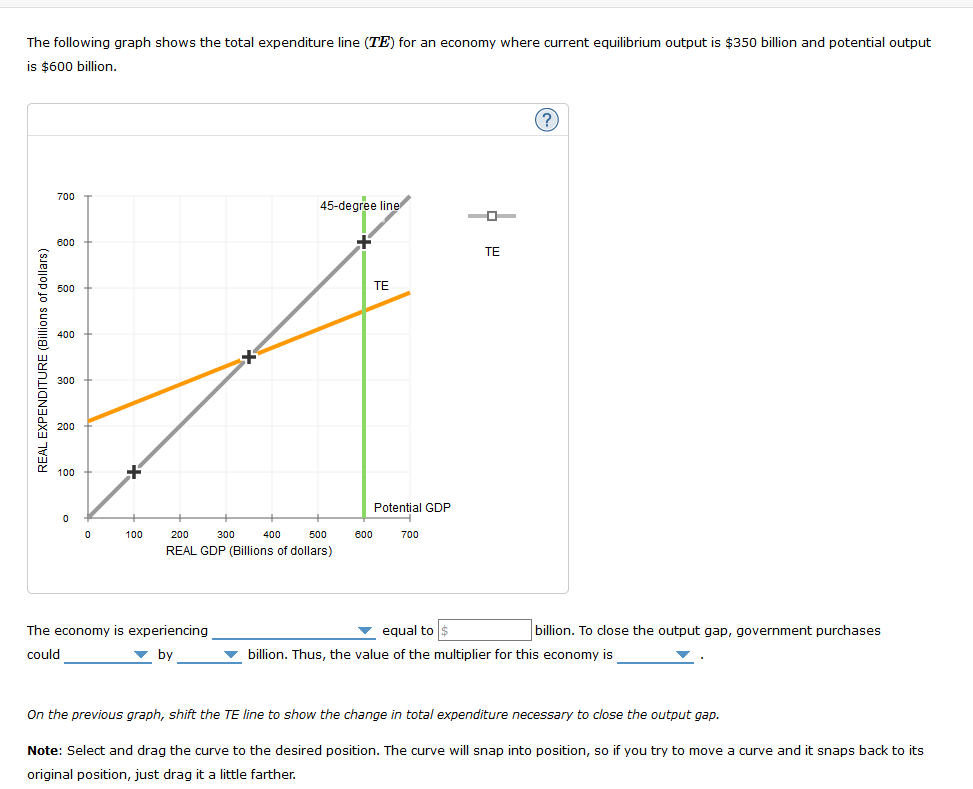
The following graph shows the total expenditure line (TE) for an economy where current equilibrium output is $350 billion and potential output is $600 billion.
The economy is experiencing _________ (a contractionary gap, an inflationary gap) equal to $______ billion. To close the output gap, government purchases could _______ (increase, decrease) by _____ ($50, 150, 75) billion. Thus, the value of the multiplier for this economy is ___________ (0.7143, 0.5833, 0.4167, 1.6667, 0.6).
Transcribed Image Text:The following graph shows the total expenditure line (TE) for an economy where current equilibrium output is $350 billion and potential output
is $600 billion.
700
45-degree line
600
TE
500
TE
400
300
200
100
Potential GDP
100
200
300
400
500
600
700
REAL GDP (Billions of dollars)
The economy is experiencing
v equal to
billion. To close the output gap, government purchases
could
v by
billion. Thus, the value of the multiplier for this economy is
On the previous graph, shift the TE line to show the change in total expenditure necessary to close the output gap.
Note: Select and drag the curve to the desired position. The curve will snap into position, so if you try to move a curve and it snaps back to its
original position, just drag it a little farther.
REAL EXPENDITURE (Billions of dollars)
Expert Solution
This question has been solved!
Explore an expertly crafted, step-by-step solution for a thorough understanding of key concepts.

This is a popular solution!

Trending now
This is a popular solution!

Step by step
Solved in 2 steps with 1 images

Knowledge Booster


Learn more about
Need a deep-dive on the concept behind this application? Look no further. Learn more about this topic, economics and related others by exploring similar questions and additional content below.Recommended textbooks for you


Macroeconomics: Principles and Policy (MindTap Co…
Economics
ISBN:
9781305280601
Author:
William J. Baumol, Alan S. Blinder
Publisher:
Cengage Learning
