The following histograms were derived using the same data on cycles to failure of aluminum test coupons. Compare the histograms. Do both display similar information? Histogram 8 bins: Histogram of Cycles to fallure (8 bins) 18 16 14- 12 10- 6- 4- 2- 1500 Cycles to fallure of akuminum test coupons 500 750 1000 1250 1750 2000 2250 Histogram 16 bins: Histogram of Cycles to fallure (16 bins) 14 12 10- 8- 4- 2- B00 1100 Cycles to failure of aluminum test coupons 200 500 1400 1700 2000 2300 O a. Yes, both give similar information. The mean value is located in the class interval having the largest frequency а. O b. Yes, both give similar information. Both graphs are also not symmetric O. Not similar information considering the number of bins are different. But both are not symmetric in shape d. Somewhat similar information. However the shape is similar and both are not symmetric Aouanba Aouanba
The following histograms were derived using the same data on cycles to failure of aluminum test coupons. Compare the histograms. Do both display similar information? Histogram 8 bins: Histogram of Cycles to fallure (8 bins) 18 16 14- 12 10- 6- 4- 2- 1500 Cycles to fallure of akuminum test coupons 500 750 1000 1250 1750 2000 2250 Histogram 16 bins: Histogram of Cycles to fallure (16 bins) 14 12 10- 8- 4- 2- B00 1100 Cycles to failure of aluminum test coupons 200 500 1400 1700 2000 2300 O a. Yes, both give similar information. The mean value is located in the class interval having the largest frequency а. O b. Yes, both give similar information. Both graphs are also not symmetric O. Not similar information considering the number of bins are different. But both are not symmetric in shape d. Somewhat similar information. However the shape is similar and both are not symmetric Aouanba Aouanba

Glencoe Algebra 1, Student Edition, 9780079039897, 0079039898, 2018
18th Edition
ISBN:9780079039897
Author:Carter
Publisher:Carter
Chapter10: Statistics
Section10.5: Comparing Sets Of Data
Problem 14PPS

Related questions
Question
Can you please help me with this
Choose only from the topics covered: Continuous Probability, Joint Probability, Descriptive Stats
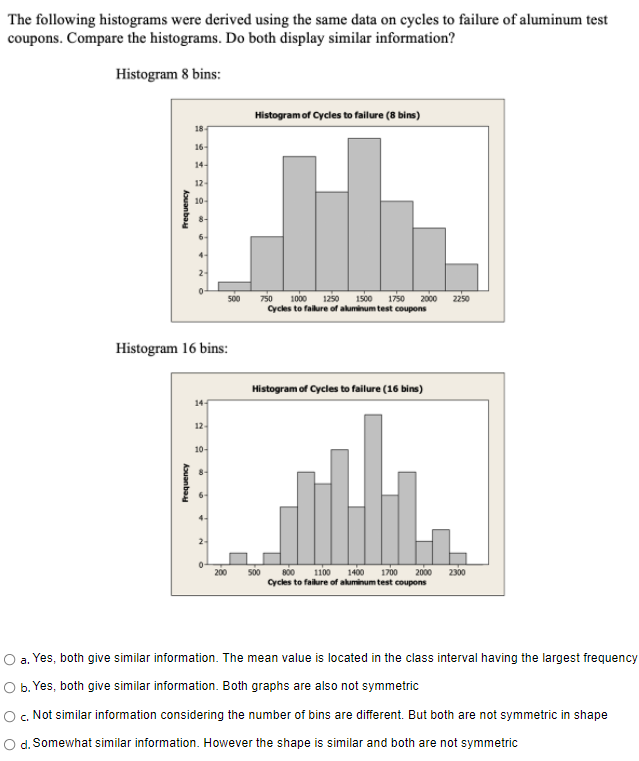
Transcribed Image Text:The following histograms were derived using the same data on cycles to failure of aluminum test
coupons. Compare the histograms. Do both display similar information?
Histogram 8 bins:
Histogram of Cycles to fallure (8 bins)
18
16
14-
12
10-
6-
4-
2-
1500
Cycles to fallure of akuminum test coupons
500
750
1000
1250
1750
2000
2250
Histogram 16 bins:
Histogram of Cycles to fallure (16 bins)
14
12
10-
8-
4-
2-
B00
1100
Cycles to failure of aluminum test coupons
200
500
1400 1700 2000
2300
O a. Yes, both give similar information. The mean value is located in the class interval having the largest frequency
а.
O b. Yes, both give similar information. Both graphs are also not symmetric
O. Not similar information considering the number of bins are different. But both are not symmetric in shape
d. Somewhat similar information. However the shape is similar and both are not symmetric
Aouanba
Aouanba
Expert Solution
This question has been solved!
Explore an expertly crafted, step-by-step solution for a thorough understanding of key concepts.

Step by step
Solved in 2 steps with 2 images

Recommended textbooks for you
Glencoe Algebra 1, Student Edition, 9780079039897…
Algebra
ISBN:
9780079039897
Author:
Carter
Publisher:
McGraw Hill
Glencoe Algebra 1, Student Edition, 9780079039897…
Algebra
ISBN:
9780079039897
Author:
Carter
Publisher:
McGraw Hill