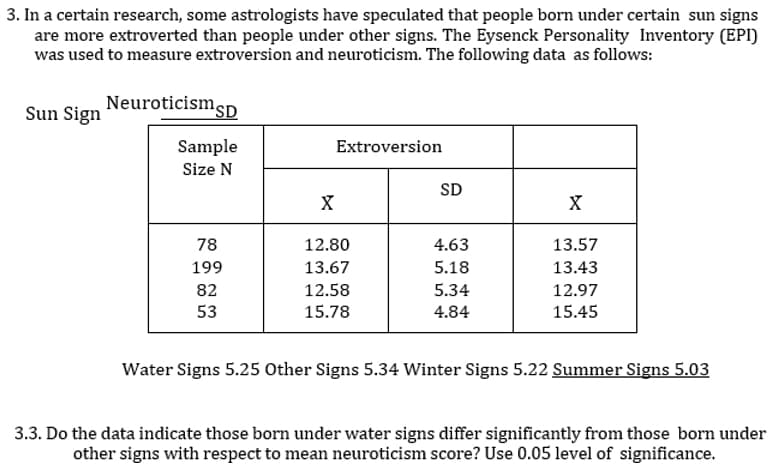
In a certain research, some astrologists have speculated that people born under certain sun signs are more extroverted than people under other signs. The Eysenck Personality Inventory (EPI) was used to measure extroversion and neuroticism. The following data as follows:
Q: _____________the information about the people from which you are gathering data from?
A: Given a statement we have to fill the blank of the statement.
Q: A dietetics student wanted to look at the relationship between calcium intake and knowledge about…
A: A dietetics student wanted to see the relationship between calcium intake and the knowledge about…
Q: The following histograms were derived using the same data on cycles to failure of aluminum test…
A: Histogram: Histogram is one of the popularly used graph for the representation of frequency…
Q: Zhanna Butulyan, a consumer analyst collected the following data on the screen sizes of popular LCD…
A: Introduction: It is known that the screen size often influences the price of an LCD television. As a…
Q: Investigate the association between eye colour of husbands and eye colour of wives from the data…
A:
Q: The following data give the percentage of women working in five companies in the retail and trade…
A: As per our guidelines, we are allowed to answer three sub-parts only. Thanks Given Data : X = %…
Q: Health care issues are receiving much attention in both academic and political arenas. A sociologist…
A: Arrange the given data in ascending order…
Q: The manager of specialty outdoor store has gathered the following data concerning sales (in hundreds…
A: The correct option is A side -by-side bar chart for the dollars of sales on hardware for each of…
Q: You are told that a study is a 3 x 3 ANOVA. Make up variables and conditions for such a study, and…
A: In Following example shows Make up variables and conditions for such a study, and create a diagram…
Q: Which of the following most closely approximates the line of best fit for the data in the…
A: NOTE: Refresh your page if you can't see any equations. . the given scatterplot is
Q: Consider the following data set representing the number of missed classes during a semester. 0 0 0…
A: (a) Obtain the five number summary. The five number summary is obtained below: Use EXCEL…
Q: For the following data, what is the value of SS within ? B1…
A: SSwithin=∑SSInside each treatments=10+20+10+20=60
Q: For the following data, what is the value of SSB? B1 B2…
A: given that B1 B2 A1 n = 5 M = 1…
Q: The following data represent the chemistry grades for a random sample of 12 freshmen at a certain…
A: Enter the given data into excel as follows:
Q: Shushanna Tovmasyan, a consumer analyst collected the following data on the screen sizes of popular…
A: Introduction: The screen size of an LCD television has the potential to affect its price. Thus, we…
Q: Consider the following data:
A: Given information: Given data represents the values of the variables x and y.
Q: Are nursing salaries in Tampa, Florida, lower than those in Dallas, Texas? As reported by the Tampa…
A: (a). Null and alternative hypothesis: The investigator is specifically interested to test whether…
Q: saw ad | did not see ad bought item did not buy item 150 250 300 1300
A:
Q: The following data are the score of 24 students in the Midterm Examination. If JM is one of these 24…
A: It is a single value within the range of data which represents a group of individuals values in a…
Q: We have to determine the UCL and the LCL by applying the above formulae to the data given in Example…
A:
Q: The following data visualization appeared on the "Our Berkeley" site from U.C. Berkeley's Office of…
A: Given Information: In Asian/Pacific Islander, %ge of students with STEM major= 30%%ge of students…
Q: To investigate the association between eye-colour of husband and eye-colour of wife, the following…
A:
Q: The top 5 students of grade 10 section Oxygen class, James, Jessie, Jane John, and Jack, are so…
A: Given Information: James got the 90th percentile, Jessie got the 9th decile, Jane got the 3rd…
Q: The boxplots summarize two data sets, 1 and 2. Which of the following must be true?
A: Box Plot: Boxplot shows the spread of data. Boxplot is a graphical representation it is given by…
Q: An experiment was conducted to compare anxiety levels among children induced between looking at real…
A: The given data is, Real snakes pictures snakes 20 15 25 20 30 35 30 35 25 20 35 32…
Q: Suppose the marketing research firm would like to examine if the social networking site that a…
A: The data shows the sample of 369 social network users were asked which site they primarily visited.
Q: A dietetics student wanted to look at the relationship between calcium intake and knowledge about…
A: Correlation is used to measure the association between two numerical variable. It explain the degree…
Q: The following data give the percentage of women working in five companies in the retail and trade…
A: (C) Many different straight lines can be drawn to provide a linear approximation of relationship…
Q: The authors of a paper describe an experiment to evaluate the effect of using a cell phone on…
A: Given Margin of error(E)=5confidence level(c)=95%The sample standard deviation from the study…
Q: Name all of the following data sets that you would expect to be skewed. I. waiting times at the bank…
A: Skewness means, not normal. If the data is normally distributed then we get a bell-shaped curve. If…
Q: Suppose the marketing research firm comScore would like to examine if the social networking site…
A: Null hypothesis: The age group of social network users and social media platform are independent…
Q: The following table gives the favorite color of each student in a large statistics class. Color…
A: The variable of the data set is "students"
Q: A research article describes a study that investigated the relationship between depression and…
A: The sample size for people who would screen positive for depression is 311, sample mean is 8.37, and…
Q: Which of the following statements is/are true regarding the fuel economy data?
A: Given information: Given data represents the values of fuel economy in MPG.
Q: Which of the following sets of data is most likely to produce a significant t statistic? Select…
A:
Q: In an upcoming decision to relocate, a new graduate’s decision on location choice comes down to…
A: Given, In an upcoming decision to relocate, a new graduate’s decision on location choice comes down…
Q: With a view to study whether the working condition in a factory had any influence on the frequency…
A:
Q: Consider the following scatterplot showing the relationship between caffeine intake and job…
A: From the scatter plot it is clear that even for high number of coffee test scores is too low. When…
Q: Of the variables you have studied so far, which type yields nonnumerical data?
A: Qualitative variable: A variable that is used for the classification of individuals based on some…
Q: From the following data, test whether there is any association between intelligence and economic…
A: There are two variables which are named as Economic Condition and Intelligence. Intelligence is the…
Q: A dietetics student wanted to look at the relationship between calcium intake and knowledge about…
A: Since you have posted a question with multiple subparts, we will solve first three subparts for you.…
Q: A sample of 10 adult men gave the following data
A: height weight 62 120 62 140 63 130 65 150 66 142 67 130 68 135 68 175 70 149…
Q: A group of people use an app to track their work outs in the gym everyday. The workouts can be…
A: Given P(work out strenuously the next day/work out strenuously on a particular day)=40% P(work out…
Q: which of the following data describes different catagories?
A: Here use basic definition of level of measurement
Q: Suppose the marketing research firm would like to examine if the social networking site that a…
A: For the given data Perform Chi square test
Q: A sample of students in a university café was asked the following questions. Identify the type of…
A:
Q: The following data represent the soc psychological test. (The higher the score 9 14
A: To construct boxplot we need five number summary.
Q: Which of the following types of data could be used to create a scatterplot? Select all that apply. O…
A: Which of the following types of data could be used to create a scatter plot? Select all that…
Step by step
Solved in 2 steps with 1 images