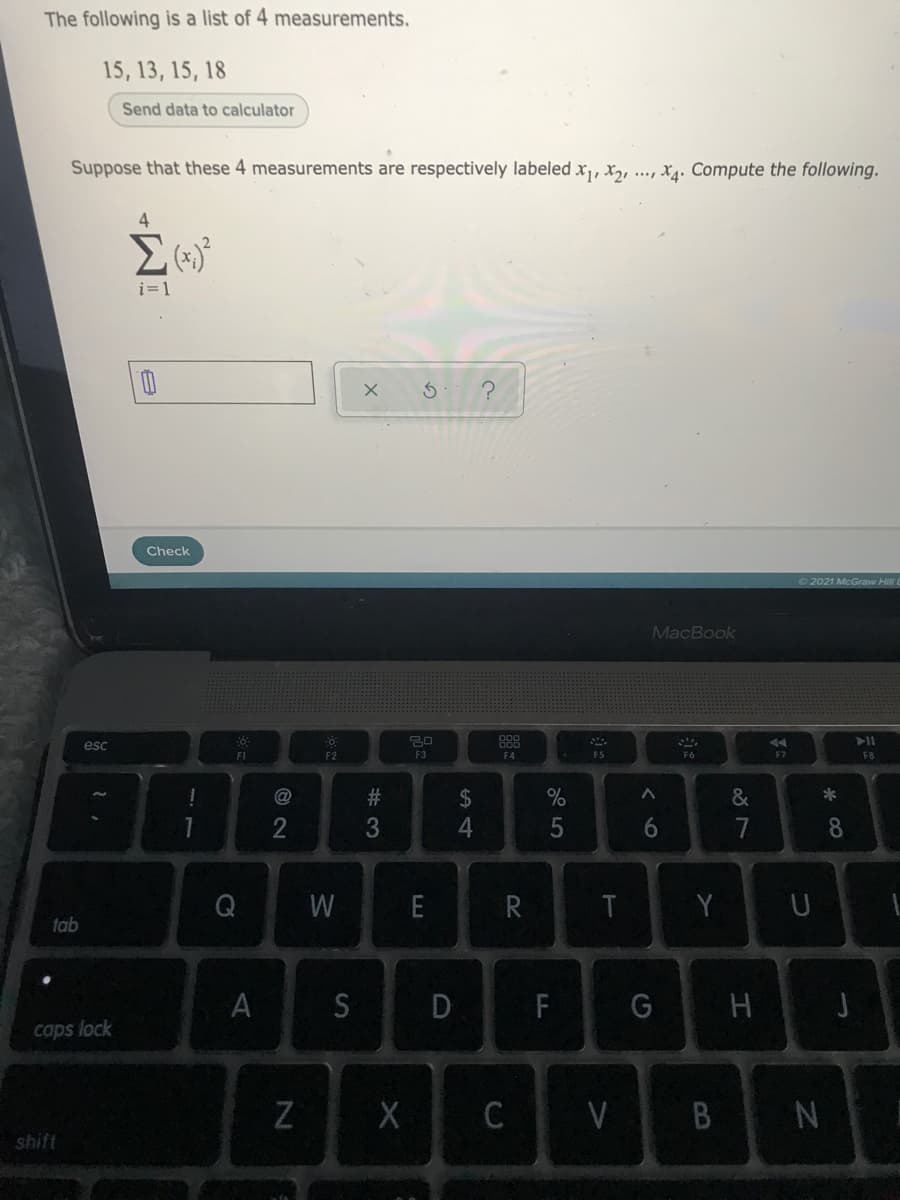
The following is a list of 4 measurements. 15, 13, 15, 18 Send data to calculator Suppose that these 4 measurements are respectively labeled x, X2, ..., x4. Compute the following. i=1 Check IM-


Q: The following is a list of 14 measurements. 84, – 77, 39, 26, – 74, – 5, - 27, – 73, – 89, – 37, –…
A: Summation (Xi/46)= (1/46)* summation (Xi) We add all the Observation first then we divide the sum by…
Q: 1. Given X = (33, 32, 32, 30, 29, 29, 28, 27,27, 25, 25, 25, 25, 24, 24, 22, 21, 20, 18, 18), use µx…
A: As per Bartleby's answering policy, we can answer only one question with a maximum of three…
Q: The following is a list of 10 measurements. 59, 37, -1, -71, 80, 88, -24, 30, -30, 51 Send data to…
A: Given that x1 = 59, x2 = 37, x3 = -1, x4 = -71, .........,x10 = 51
Q: You may use a spreadsheet for these calculations, but you must provide clear evidence of the…
A: Hello! As you have posted more than 3 sub parts, we are answering the first 3 sub-parts(mean,…
Q: The following is a list of 14 measurements. -34, 82, -33, -7,-28, -26,-82,-44, -9, 6, 84, 41, -87,…
A: Given: The 14 measurements are -34, 82, -33, -7, -28, -26, -82, -44, -9, 6, 84, 41, -87, 73. The…
Q: Find the following z-score corresponding to X = 40 and the X value corresponding to z = 0.25 for…
A:
Q: Consider the following data: 3 4 P(X = x) 0.2 0.1 0.1 0.2 0.4 Step 4 of 5: Find the value of P(X <…
A: Given probability distribution table: x 1 2 3 4 5 P(X=x) 0.2 0.1 0.1 0.2 0.4 Find:…
Q: The two data sets are dependent. Find d to the nearest tenth. X21 6872 55 68 57 Y 90 787A193 O 20 O…
A: The sample size n is 6.
Q: The following is a list of 11 measurements. 13, 28, -7, 91, -82, 37, -92, -62, 13, 24, 97 Send data…
A: We have given that, The list of 11 measurements is, 13, 28, -7, 91, -82, 37, -92, -62, 13, 24, 97…
Q: 5. From the data given below, find the number of items n. r= +0.5, Exy = 120, o, = 8, Er = 90 where…
A:
Q: The following is a list of 10 measurements. -71, 21, 40, -17, -36, 50, 81, 76, -81, -85 Send data to…
A: List of 10 measurements-71,21,40,-17,-36,50,81,76,-81,-85there 10 measurement labeled as…
Q: Two analysts were given a standard reference material (SRM) and were asked to determine its copper…
A: Given the data of the results (mg/kg) of analysts A and B as Analyst A Analyst B 45.2 49.4…
Q: For a population with u 80 and o 9, find the z-score for each of the following X values. (Note: You…
A: Given data,μ=80σ=9
Q: The following is a list of 15 measurements. 66, – 3, 90, 51, –97, 68, – 17, – 3, - 68, – 8, 77, –…
A: A list of 15 measurements are 66, -3, 90, 51, -97, 68, -17, -3, -68, -8, 77, -57, 86, 35, -63.
Q: Consider the following temperature readings (measured in Celsius scale) of few days in Dhaka city…
A:
Q: 2. Determine the approximate value of y if x = 1.5 for the data set {(-1, 5), (0, 1), (1, 1), (2,…
A:
Q: For a population with m = 80 and s = 9, find the z-score for each of the following X values. (Note:…
A: Given Information: m = 80 and s = 9 Z-score is standardized value that specifies the exact location…
Q: The following is a list of 11 measurements. - 89, 18, -21, -85, -3, -21, -94, -43, -45, -44, -25…
A: Number of observations=11 The given observations are -89,18,-21,-85,-3,-21,-94,-43,-45,-44,-25 The…
Q: Using the data attached, compute the following 1. x-bar= 2. Sx= 3. n=
A:
Q: Stephens, Atkins, and Kingston (2009) conducted a research study demonstrating that swearing can…
A: In order to determine whether swearing helped with pain tolerance, conduct a two mean comparison…
Q: The following C.I.s were obtained for the mean of the same po [16, 23] and [18, 25]. Identify the…
A: From the given information, The C.I for the mean are [16, 23] and [18, 25] Consider, [16, 23].
Q: The following is a list of 15 measurements. 17, -71, – 11, - 63, – 21, 84, – 2, – 89, 36, 30, 65,…
A: Given data set, =?
Q: The following is a list of 4 measurements. 9, 15, 11, 17 Send data to calculator Send data to Excel…
A: Find sum of squares of observations 9,15,11,17
Q: Compute the number significant digits for a given relative error r.e.=0.005. O 4 O 2 O 3.0000 O 3
A:
Q: The following is a list of Pearson’s r coefficients. Which Pearson’s r indicates the strongest…
A: Given Solution:
Q: The following s a list of 6 measurements. 13, 18, 16, 7, 7, 12 Suppose that these 6. measurements…
A: According to the provided information, the list of measurements are: 13, 18, 16, 7, 7, 12
Q: The cross-table created after the observations made according to the patients' post-treatment…
A: Any assumption about the parameter or probability function is known as hypothesis testing. For the…
Q: (a) If x = 104 and s = 9.5, compute the test statistic. t= (Round to three decimal places as…
A: Here Given μ=100n=21 x¯=104 s=9.5
Q: Q. 18. Calculate mode from the following 15 observations : 5, 4, 8, 7, 12, 18, 17, 30, 8, 12, 20,…
A:
Q: Q13. For the following set of numbers: 8, 12, 20, 6, 11, 12, 11, 12 a) Organise the data into a…
A: From the provided data
Q: eckman hypothesized that experience playing video games would improve a rson's spatial skills. Each…
A: Here we conduct paired t test.
Q: The following is a list of measurements. 14, 18, 20, 17, 14 Suppose that these ) measurements are…
A: Let "xi" is the list of measurements. xi 14 18 20 17 14
Q: In this example with the help of the following details in the table of the 6 people having a…
A: Given that,
Q: The following is a list of 15 measurements. -16, -39, -6, –-47, 24, -65, –80, 29, 74, 53, 50, 26,…
A:
Q: The graph above shows a line of best fit for data collected on be ant ezedywas and waiteses week in…
A: When x = 0, y = 375 Similarly, if x = 150, y = 625 So, two points are (0,375) and (150,625)
Q: The following is a list of 14 measurements. - 13, -6, -45, 53, –3, 83, –23, 79, – 17, –96, – 18, 91,…
A: Given: A list of 14 measurements. -13,-6,-45,53,-3,83,-23,79,-17,-96,-18,91,53,-13
Q: The following is a list of 6 measurements. 15, 19, 7, 11, 17, 13 Send data to calculator Suppose…
A: The given data is 15, 19, 7, 11, 17, 13
Q: A sample of size 40 yields the following sorted data. Note that I have x-ed out a(39) (the sec- ond…
A: (b) The one sd interval ranges from 63.5-12.33=51.17 to 63.5+12.33=75.83 This interval contains…
Q: Consider the following data: 4 7 P(X = x) 0.2 0.2 0.2 0.2 0.2 %3D Step 5 of 5: Find the value of P(X…
A: We have given the following data x 4 5 6 7 8 P(X = x) 0.2 0.2 0.2 0.2 0.2 We have to find-…
Q: The following is a list of ) measurements. 13, 5, 15, 20, 15 Suppose that these 5 measurements are…
A:
Q: The following is a list of 12 measurements. -44, -10,-77, 9, 49, -94, -59, -6, 15, 16, -74, 6 Send…
A: Solution-: We have following data: - 44, -10, -77, 9, 49, -94, -59, -6, 15, 16, -74, 6 We want to…
Q: T=5, T, = 10, T3 =15, with SS1 = 6, SS2=9, SS3 = 9, and EX² = 94. For this study, what is SSwithin?
A:
Q: The following is a list of 15 measurements. -39, 51, -6, -78, -41, -86, -51, -20, 91, 75, -28, 19,…
A: The measurements are x1 = -39, x2 = 51, x3 = -6, x4 = -78,......., x14 = 87, x15 = 21
Q: Q1/ Four engineering classes A, B, C and, D were tested for the percentage of students success in…
A:
Q: The following is a list of 6 measurements. 11, 17, 7, 8, 16, 20 Send data to calculator Suppose that…
A: Here we need to find the summation of the given data set.
Q: Use the following picture to answer the question. > t. test(x, alternative - "greater", mu - 2) One…
A: From the given output, The test is 'one sample t test' The value of t is 2.6667,
Q: topred, 1. Find the following critical values: 10.025,12 JA FOR JAVS benisiio mebea b) '0.05,20…
A: a) t critical value : Degrees of freedom (df) = 12 ; α2= 0.025 From t distribution table One…
Q: Given are five observations for two variables, x and y. Use Table 2 of Appendix B. Xi 2 3 4 5 Yi 4 8…
A: Hello! As you have posted more than 3 sub parts, we are answering the first 3 sub-parts. In case…
Q: Consider the following data points, where the first coordinate corresponds to x and the second…
A: 1): missing value of y =-2/15 2): value of x at which yhat is zero =8/3
Q: The following is a list of 10 measurements. -9, 50, 99, -49, 12, -42, -61, -57, -15, -41 Send data…
A: The following is a list of 10 measurements. -9, 50, 99,-49, 12, -42,-61,-57, -15,-41


Trending now
This is a popular solution!

Step by step
Solved in 2 steps with 2 images

- Two analysts were given a standard reference material (SRM) and were asked to determine its copper concentration (in mg/kg) using the EPA standard method. Each analyst was given sufficient time so they could produce as many accurate results as possible. Their results (mg/kg) were as follows: Analyst A 45.2, 47.3, 51.2, 50.4, 52.2, 48.7 (Standard error s = 2.62) Analyst B 49.4, 50.3, 51.6, 52.1, 50.9 (Standard error s = 1.06) (a) For Analyst A, is 52.2 mg/kg a possible outlier? (b) Calculate the RSD for each student; which analyst is more precise? (c) If the known concentration of copper in SRM is 49.5 mg/kg, which analyst is more accurate (without considering the deletion of outliers if any)?A data with 18 points will be integrated as accurately as possible using a combination of Simpson's rules. It will require ____ applications of Simpson's 3/8th rule and _____ applications of Simpson's 1/3rd ruleThe director of a shipping company believes that there is a relationship between the cost of a customer’s shipment (£) and the weight (lb) of the package being shipped. For investigating this possible relationship, a random sample of nine customer shipments was selected and the weight (in lb) and the cost (rounded to the nearest £) for each shipment were recorded. The results obtained are shown in the table below (on the picture). required: a) ) The scatter diagram showing the relationship between the cost of acustomer’s shipment (£) and the weight (lb) of the package being shipped, is given below. Comment fully and clearly on this diagram. i) ii)
- A dentist wanted to determine if a relationship existed between childhood fluoride exposure and cavities. She took a sample of adults in her practice and counted how many cavities each person had in his or her permanent teeth. She also determined how many years of childhood each person was exposed to tap water with fluoride. The minimum value on this variable was 0 and the maximum was 18. Using the data below, an alpha of .05 and a two-tailed test, was there a significant relationship? Years of fluoride Number of cavities 0 10 18 1 2 7 12 3 3 4 10 5 M = 7.5s =6.98 M = 5.00s = 3.16A running coach wanted to see whether runners run at a different speed after eating spaghetti the night before a race. For a 5-km race, two samples were chosen: 5 runners who had a regular dinner the night before and 10 runners who had a spaghetti dinner the night before. Their results (in seconds) are in the table below. At α = 0.04, assuming unequal population variances, and using the Welch-Satterthwaite (i.e., exact) equation to calculate the degrees of freedom, do the data support the alternative hypothesis that runners do indeed run at a different speed after eating spaghetti?For each of the studies presented below: (1) Define the population parameter of interest to the researchers and (2) Estimate the population parameter defined in (1), with a point estimate. (a) A 42-inch, large-screen, plasma TV is designed to consume only 350 watts and therefore produce less heat. In order to check this specification, a sample of plasma TVs was obtained and the power consumption was measured for each. The sample mean power consumption was 353.8 watts. (b) A sports physiologist is interested in the proportion of professional marathon runners who have very high haemoglobin counts. To this end, the researcher randomly selects 150 elite marathon runners, measures their haemoglobin levels and records it as either very high or normal. The researcher found that 48 subjects in the sample had very high haemoglobin counts.
- A paper investigated the driving behavior of teenagers by observing their vehicles as they left a high school parking lot and then again at a site approximately 1 2 mile from the school. Assume that it is reasonable to regard the teen drivers in this study as representative of the population of teen drivers. Amount by Which Speed Limit Was Exceeded MaleDriver FemaleDriver 1.3 -0.1 1.3 0.4 0.9 1.1 2.1 0.7 0.7 1.1 1.3 1.2 3 0.1 1.3 0.9 0.6 0.5 2.1 0.5 (a) Use a .01 level of significance for any hypothesis tests. Data consistent with summary quantities appearing in the paper are given in the table. The measurements represent the difference between the observed vehicle speed and the posted speed limit (in miles per hour) for a sample of male teenage drivers and a sample of female teenage drivers. (Use μmales − μfemales.Round your test statistic to two decimal places. Round your degrees of freedom down to the nearest whole number. Round your p-value to…For all students enrolled during the previous Spring semester, it was found that 48% of all those students enrolled utilized the services of the English Study Skills Center (ESSC). This numerical measure would be considered a: A) Parameter B) StatisticA paper investigated the driving behavior of teenagers by observing their vehicles as they left a high school parking lot and then again at a site approximately 1 2 mile from the school. Assume that it is reasonable to regard the teen drivers in this study as representative of the population of teen drivers. Amount by Which Speed Limit Was Exceeded MaleDriver FemaleDriver 1.2 -0.1 1.4 0.4 0.9 1.1 2.1 0.7 0.7 1.1 1.3 1.2 3 0.1 1.3 0.9 0.6 0.5 2.1 0.5 (a) Use a .01 level of significance for any hypothesis tests. Data consistent with summary quantities appearing in the paper are given in the table. The measurements represent the difference between the observed vehicle speed and the posted speed limit (in miles per hour) for a sample of male teenage drivers and a sample of female teenage drivers. (Use μmales − μfemales.Round your test statistic to two decimal places. Round your degrees of freedom down to the nearest whole number. Round your p-value to…
- Suppose a researcher is interested in the relationship between periodontal disease and a number of negative health outcomes. One outcome of particular interest to the researcher is hypertension (assume defined as systolic blood pressure above 140 mmHG). Suppose a team gathers a SRS of 348 participants with periodontal disease, and finds the sample average systolic blood pressure to be 157 mmHG. A) Using an assumed σ=16 mmHG, conduct a 1 sample Z test to determine if there is a relationship between periodontal disease and hypertension in this population. (Use α=0.05)Table 7 lists the numbers of violent crimes reported to police on randomly selected daysfor this year. The data are taken from three large cities of about the same size.TABLE 7Citi A City B City C5 2 89 4 1212 1 103 13 39 7 97 6 1413At 5% significance level, will you conclude that the numbers of violent reported to police forthree large cities is the sameThe attached data contains Part Quality data of three suppliers. At = 0.05, does Part Quality depend on Supplier, or should the cheapest Supplier be chosen?