The following is a list of 14 measurements. 84, – 77, 39, 26, – 74, – 5, - 27, – 73, – 89, – 37, – 23, 82, 76, – 85 Send data to calculator Send data to Excel Suppose that these 14 measurements are respectively labeled x, x2, ., x14. (Thus, 84 is labeled x, -77 is labeled x,, and so on.) Compute the following. 14 i = 1 Round your answer to at least two decimal places.
The following is a list of 14 measurements. 84, – 77, 39, 26, – 74, – 5, - 27, – 73, – 89, – 37, – 23, 82, 76, – 85 Send data to calculator Send data to Excel Suppose that these 14 measurements are respectively labeled x, x2, ., x14. (Thus, 84 is labeled x, -77 is labeled x,, and so on.) Compute the following. 14 i = 1 Round your answer to at least two decimal places.

Glencoe Algebra 1, Student Edition, 9780079039897, 0079039898, 2018
18th Edition
ISBN:9780079039897
Author:Carter
Publisher:Carter
Chapter10: Statistics
Section10.1: Measures Of Center
Problem 14PPS

Related questions
Topic Video
Question
Transcribed Image Text:O MATHEMATICAL READINESS
Shasia v
Summation of indexed data
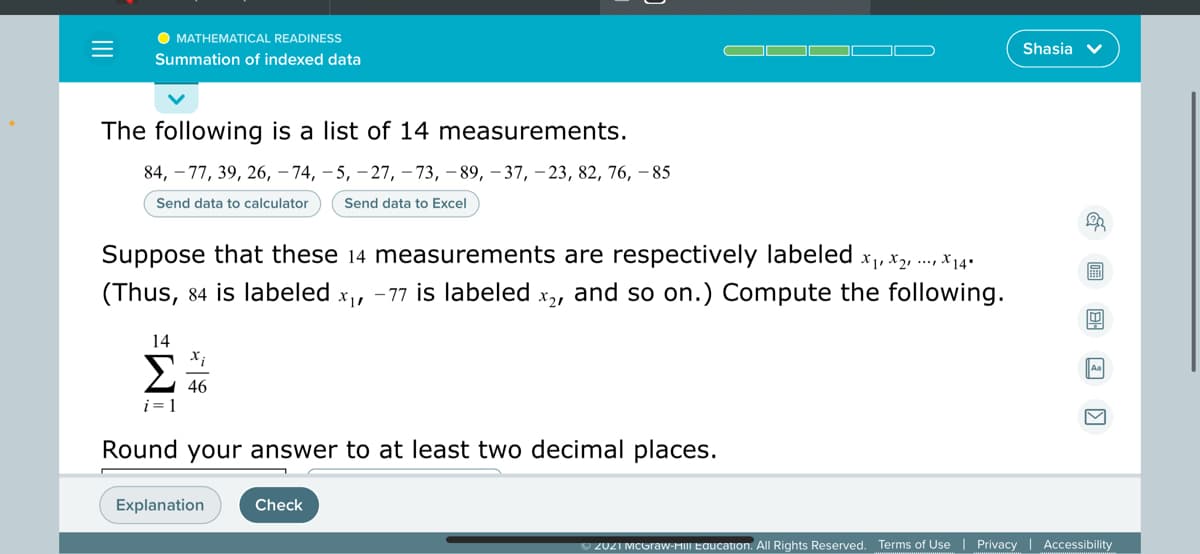
The following is a list of 14 measurements.
84, – 77, 39, 26, – 74, – 5, – 27, – 73, – 89, – 37, – 23, 82, 76, –85
Send data to calculator
Send data to Excel
Suppose that these 14 measurements are respectively labeled x,, x2, ., x14+
(Thus, 84 is labeled
- 77 is labeled
X21
and so on.) Compute the following.
14
Σ
46
i = 1
Round your answer to at least two decimal places.
Explanation
Check
O 2021 MCGraw-HIII Education. All Rights Reserved. Terms of Use | Privacy | Accessibility
II
Expert Solution
Step 1
Summation (Xi/46)= (1/46)* summation (Xi)
We add all the Observation first then we divide the sum by 46

Trending now
This is a popular solution!

Step by step
Solved in 2 steps

Knowledge Booster


Learn more about
Need a deep-dive on the concept behind this application? Look no further. Learn more about this topic, statistics and related others by exploring similar questions and additional content below.Recommended textbooks for you
Glencoe Algebra 1, Student Edition, 9780079039897…
Algebra
ISBN:
9780079039897
Author:
Carter
Publisher:
McGraw Hill

Algebra & Trigonometry with Analytic Geometry
Algebra
ISBN:
9781133382119
Author:
Swokowski
Publisher:
Cengage

Glencoe Algebra 1, Student Edition, 9780079039897…
Algebra
ISBN:
9780079039897
Author:
Carter
Publisher:
McGraw Hill
Algebra & Trigonometry with Analytic Geometry
Algebra
ISBN:
9781133382119
Author:
Swokowski
Publisher:
Cengage