eckman hypothesized that experience playing video games would improve a rson's spatial skills. Each participant's spatial skills were measured. Participants en played video games for two hours and their spatial skills were measured again the end of the game. The number of correct spatial problems was recorded for ch participant. Analyze the following data, state your null hypothesis, and report our critical value using a = .05. Interpret your results. Sp = 2.8 %3D %3D Before After 10 M = 5.33 M = 7
eckman hypothesized that experience playing video games would improve a rson's spatial skills. Each participant's spatial skills were measured. Participants en played video games for two hours and their spatial skills were measured again the end of the game. The number of correct spatial problems was recorded for ch participant. Analyze the following data, state your null hypothesis, and report our critical value using a = .05. Interpret your results. Sp = 2.8 %3D %3D Before After 10 M = 5.33 M = 7

Glencoe Algebra 1, Student Edition, 9780079039897, 0079039898, 2018
18th Edition
ISBN:9780079039897
Author:Carter
Publisher:Carter
Chapter10: Statistics
Section10.3: Measures Of Spread
Problem 1GP

Related questions
Question
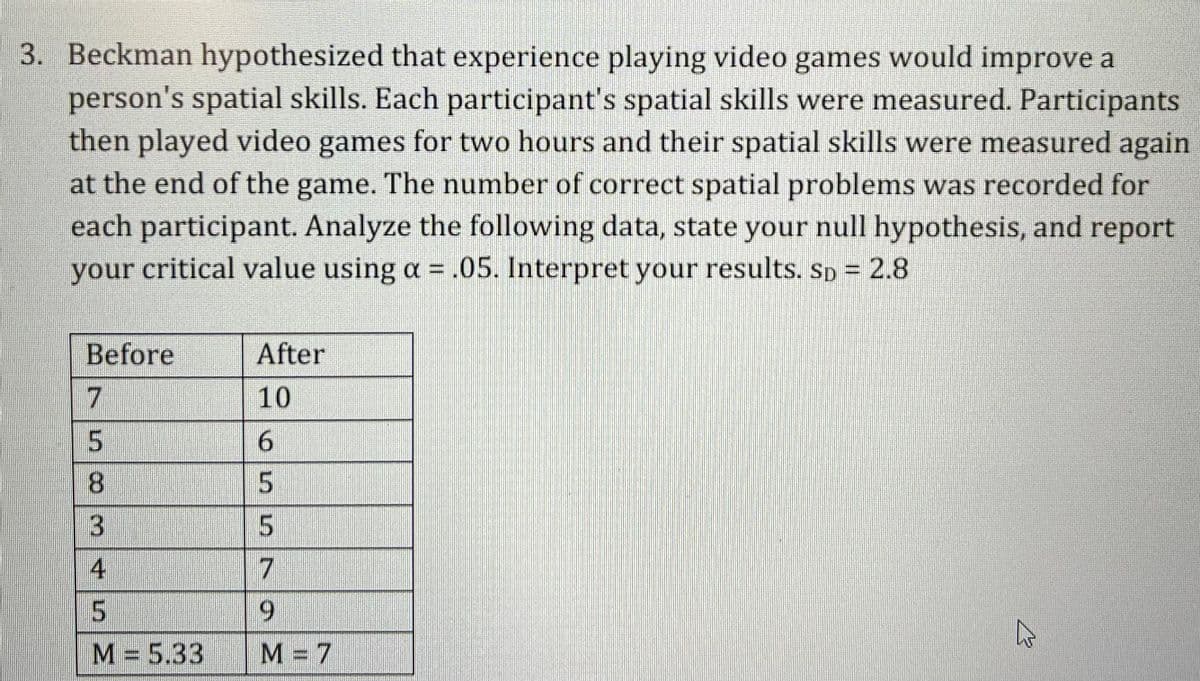
Transcribed Image Text:3. Beckman hypothesized that experience playing video games would improve a
person's spatial skills. Each participant's spatial skills were measured. Participants
then played video games for two hours and their spatial skills were measured again
at the end of the game. The number of correct spatial problems was recorded for
each participant. Analyze the following data, state your null hypothesis, and report
your critical value using a = .05. Interpret your results. Sp = 2.8
Before
After
7
10
8.
4
M = 5.33
M = 7
655 79
Expert Solution
This question has been solved!
Explore an expertly crafted, step-by-step solution for a thorough understanding of key concepts.

This is a popular solution!

Trending now
This is a popular solution!

Step by step
Solved in 2 steps

Recommended textbooks for you
Glencoe Algebra 1, Student Edition, 9780079039897…
Algebra
ISBN:
9780079039897
Author:
Carter
Publisher:
McGraw Hill
Glencoe Algebra 1, Student Edition, 9780079039897…
Algebra
ISBN:
9780079039897
Author:
Carter
Publisher:
McGraw Hill