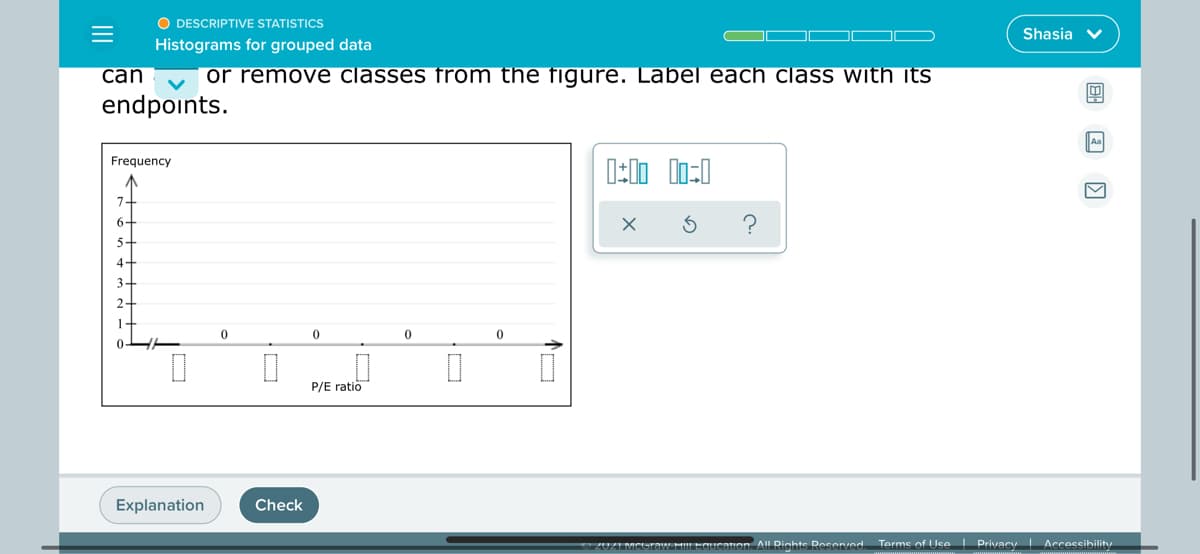
The following is a list of P/E ratios (current stock price divided by company's earnings per share) for 17 companies. 57, 53, 50, 46, 42, 35, 31, 37, 37, 37, 34, 34, 30, 30, 55, 55, 51 Send data to calculator Draw the histogram for these data using an initial class boundary of 29.5, an ending class boundary of 59.5, and 5 classes of equal width. Note that you can add or remove classes from the figure. Label each class with its endpoints.
The following is a list of P/E ratios (current stock price divided by company's earnings per share) for 17 companies. 57, 53, 50, 46, 42, 35, 31, 37, 37, 37, 34, 34, 30, 30, 55, 55, 51 Send data to calculator Draw the histogram for these data using an initial class boundary of 29.5, an ending class boundary of 59.5, and 5 classes of equal width. Note that you can add or remove classes from the figure. Label each class with its endpoints.

Glencoe Algebra 1, Student Edition, 9780079039897, 0079039898, 2018
18th Edition
ISBN:9780079039897
Author:Carter
Publisher:Carter
Chapter10: Statistics
Section: Chapter Questions
Problem 25SGR

Related questions
Question
100%
Transcribed Image Text:O DESCRIPTIVE STATISTICS
Shasia v
Histograms for grouped data
can
or remove classes from the figure. Label each clas S with its
endpoints.
Aa
Frequency
7-
6-
5-
4-
3-
2-
P/E ratio
Explanation
Check
2UZI MCUraw HlLEGucation. All Rights Reser/ed.
Terms of Use I Privacy Accessibility
Transcribed Image Text:Pf Sign Off Successful
Bb Week 8 - MAT300457VA016-121...
A ALEKS - Shasia Gibbs - Learn
O DESCRIPTIVE STATISTICS
Shasia v
Histograms for grouped data
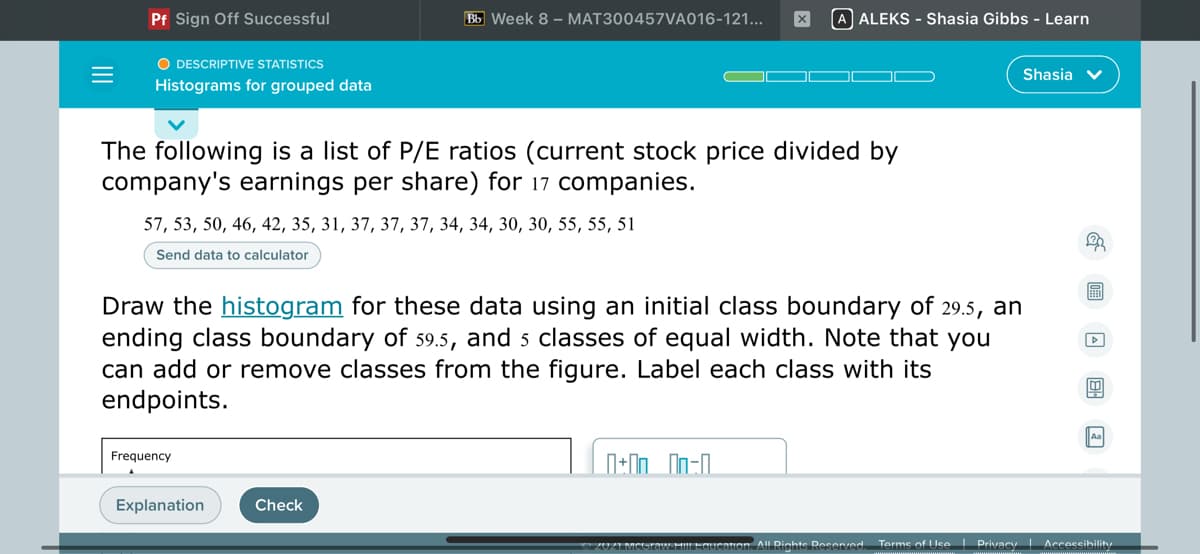
The following is a list of P/E ratios (current stock price divided by
company's earnings per share) for 17 companies.
57, 53, 50, 46, 42, 35, 31, 37, 37, 37, 34, 34, 30, 30, 55, 55, 51
Send data to calculator
圖
Draw the histogram for these data using an initial class boundary of 29.5, an
ending class boundary of s9.5, and 5 classes of equal width. Note that you
can add or remove classes from the figure. Label each class with its
endpoints.
Frequency
Explanation
Check
20ZIMCUraw HilLEGUIcation AlL Rights Resened.
Terms of Use I Privacy Accessibility
Expert Solution
This question has been solved!
Explore an expertly crafted, step-by-step solution for a thorough understanding of key concepts.

This is a popular solution!

Trending now
This is a popular solution!

Step by step
Solved in 2 steps with 2 images

Knowledge Booster


Learn more about
Need a deep-dive on the concept behind this application? Look no further. Learn more about this topic, statistics and related others by exploring similar questions and additional content below.Recommended textbooks for you
Glencoe Algebra 1, Student Edition, 9780079039897…
Algebra
ISBN:
9780079039897
Author:
Carter
Publisher:
McGraw Hill

Big Ideas Math A Bridge To Success Algebra 1: Stu…
Algebra
ISBN:
9781680331141
Author:
HOUGHTON MIFFLIN HARCOURT
Publisher:
Houghton Mifflin Harcourt
Glencoe Algebra 1, Student Edition, 9780079039897…
Algebra
ISBN:
9780079039897
Author:
Carter
Publisher:
McGraw Hill
Big Ideas Math A Bridge To Success Algebra 1: Stu…
Algebra
ISBN:
9781680331141
Author:
HOUGHTON MIFFLIN HARCOURT
Publisher:
Houghton Mifflin Harcourt