The following is the frequency distribution of the sample weight from field of chickens in grams, size 100, selected from a farm after 45 days. weight 720-700 700-680 680-660 660-640 640-620 620-600 No. of 10 20 25 20 15 10 chickens Draw the following 1- Histogram 2- A relative histogram 3- Polygon 4- A Relative Frequency Curve
The following is the frequency distribution of the sample weight from field of chickens in grams, size 100, selected from a farm after 45 days. weight 720-700 700-680 680-660 660-640 640-620 620-600 No. of 10 20 25 20 15 10 chickens Draw the following 1- Histogram 2- A relative histogram 3- Polygon 4- A Relative Frequency Curve

Glencoe Algebra 1, Student Edition, 9780079039897, 0079039898, 2018
18th Edition
ISBN:9780079039897
Author:Carter
Publisher:Carter
Chapter10: Statistics
Section10.4: Distributions Of Data
Problem 19PFA

Related questions
Question
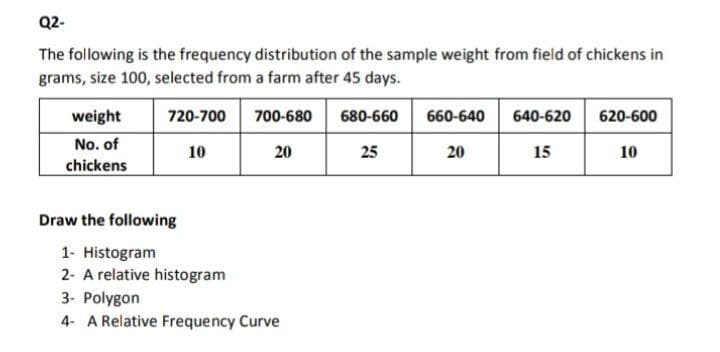
Transcribed Image Text:Q2-
The following is the frequency distribution of the sample weight from field of chickens in
grams, size 100, selected from a farm after 45 days.
weight
720-700
700-680
680-660
660-640
640-620
620-600
No. of
10
20
25
20
15
10
chickens
Draw the following
1- Histogram
2- A relative histogram
3- Polygon
4- A Relative Frequency Curve
Expert Solution
This question has been solved!
Explore an expertly crafted, step-by-step solution for a thorough understanding of key concepts.

Step by step
Solved in 2 steps with 4 images

Recommended textbooks for you
Glencoe Algebra 1, Student Edition, 9780079039897…
Algebra
ISBN:
9780079039897
Author:
Carter
Publisher:
McGraw Hill
Glencoe Algebra 1, Student Edition, 9780079039897…
Algebra
ISBN:
9780079039897
Author:
Carter
Publisher:
McGraw Hill