The following linear plot is derived from a function of the form y = aeb, where a and b are constants. 45 4 3.5 3 > 2.5 2 1.5 1 0.5 0.1 0.2 0.3 0.4 0.5 0.6 For the function y = ae* from which the data points on the graph were derived, the numerical value of the constants are a = and b = In y
The following linear plot is derived from a function of the form y = aeb, where a and b are constants. 45 4 3.5 3 > 2.5 2 1.5 1 0.5 0.1 0.2 0.3 0.4 0.5 0.6 For the function y = ae* from which the data points on the graph were derived, the numerical value of the constants are a = and b = In y

Functions and Change: A Modeling Approach to College Algebra (MindTap Course List)
6th Edition
ISBN:9781337111348
Author:Bruce Crauder, Benny Evans, Alan Noell
Publisher:Bruce Crauder, Benny Evans, Alan Noell
Chapter3: Straight Lines And Linear Functions
Section3.3: Modeling Data With Linear Functions
Problem 23SBE

Related questions
Question
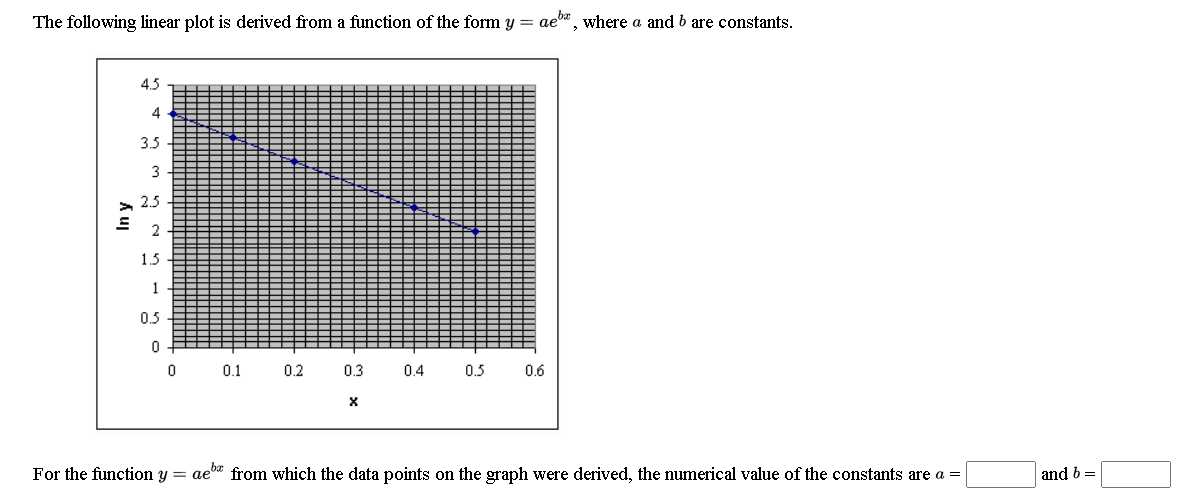
Transcribed Image Text:The following linear plot is derived from a function of the form y = aeba, where a and b are constants.
4.5
4
3.5
3
2.5
2
1.5
1
0.5
0.1
0.2
0.3
0.4
0.5
0.6
For the function y = ae* from which the data points on the graph were derived, the numerical value of the constants are a =
and b =
Expert Solution
This question has been solved!
Explore an expertly crafted, step-by-step solution for a thorough understanding of key concepts.

This is a popular solution!

Trending now
This is a popular solution!

Step by step
Solved in 3 steps with 3 images

Recommended textbooks for you
Functions and Change: A Modeling Approach to Coll…
Algebra
ISBN:
9781337111348
Author:
Bruce Crauder, Benny Evans, Alan Noell
Publisher:
Cengage Learning

Algebra & Trigonometry with Analytic Geometry
Algebra
ISBN:
9781133382119
Author:
Swokowski
Publisher:
Cengage
Functions and Change: A Modeling Approach to Coll…
Algebra
ISBN:
9781337111348
Author:
Bruce Crauder, Benny Evans, Alan Noell
Publisher:
Cengage Learning
Algebra & Trigonometry with Analytic Geometry
Algebra
ISBN:
9781133382119
Author:
Swokowski
Publisher:
Cengage