Which of the following plots best represents level curves (with c=-1, 0, 0.5, 1, 2, and 4) of the function f? -1 -1 05 -2 A) В) -2 -2 -1 2 0:5 -1 -2 D) -1 -2 -1
Which of the following plots best represents level curves (with c=-1, 0, 0.5, 1, 2, and 4) of the function f? -1 -1 05 -2 A) В) -2 -2 -1 2 0:5 -1 -2 D) -1 -2 -1

Chapter3: Functions
Section3.3: Rates Of Change And Behavior Of Graphs
Problem 2SE: If a functionfis increasing on (a,b) and decreasing on (b,c) , then what can be said about the local...

Related questions

Question

Transcribed Image Text:A function f : R? → R is given by f(x, y) = (x² + y² + 1)2 – 4x².
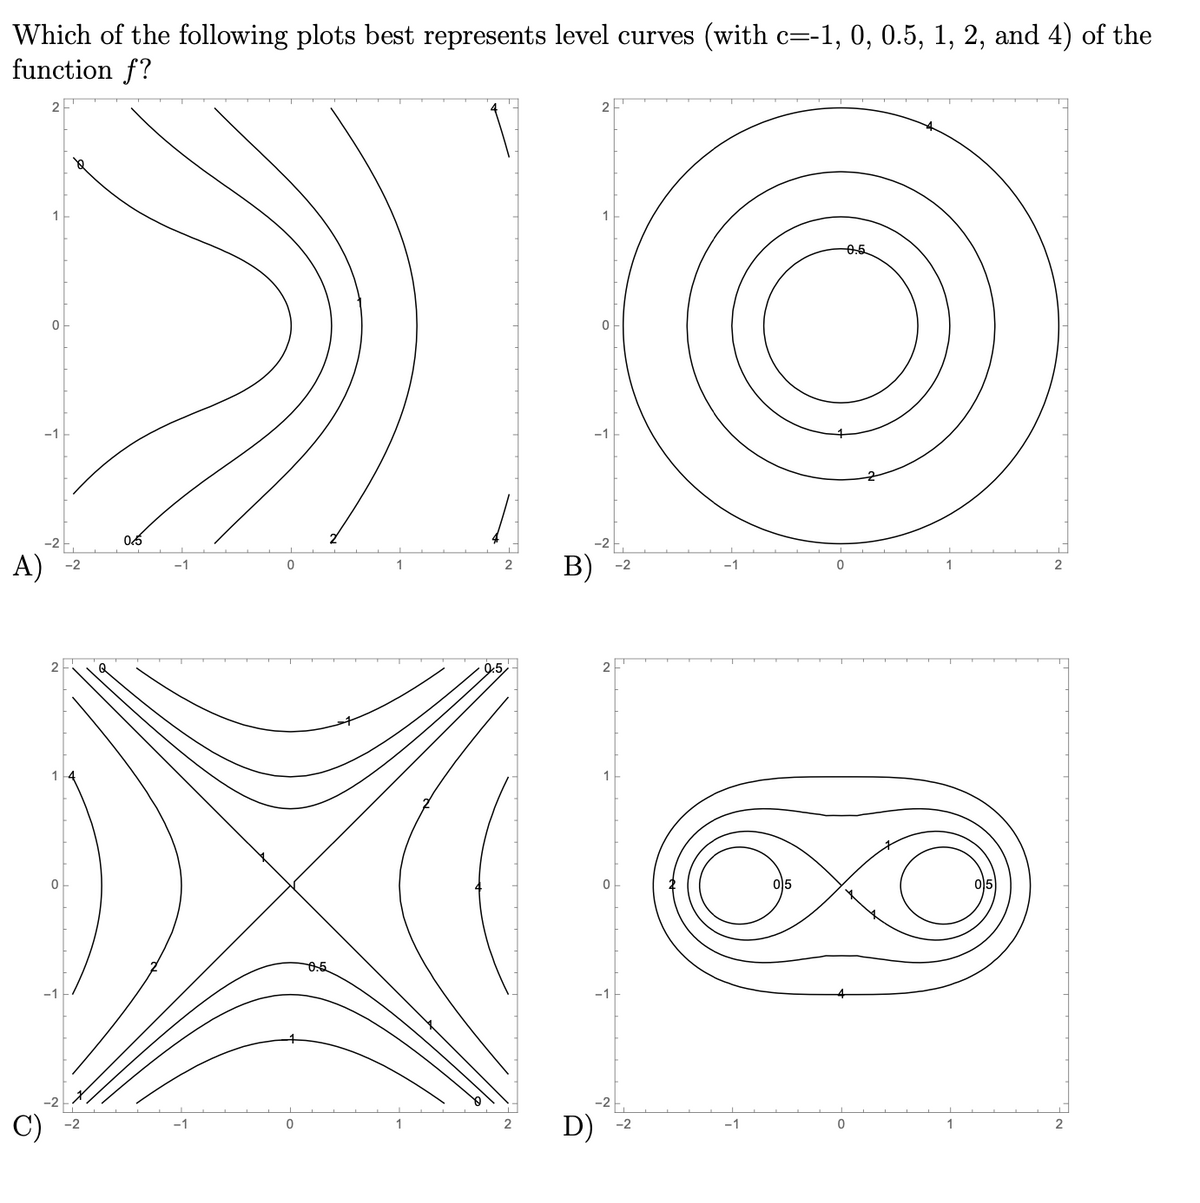
Transcribed Image Text:Which of the following plots best represents level curves (with c=-1, 0, 0.5, 1, 2, and 4) of the
function f?
!!
2
1
0.5
-1
0,6
A)
B)
-2
-1
0
-2
-1
2
0:5
-2
C)
D)
-2
1
-2
1
2
Expert Solution
This question has been solved!
Explore an expertly crafted, step-by-step solution for a thorough understanding of key concepts.

This is a popular solution!

Trending now
This is a popular solution!

Step by step
Solved in 2 steps with 1 images

Knowledge Booster


Learn more about
Need a deep-dive on the concept behind this application? Look no further. Learn more about this topic, advanced-math and related others by exploring similar questions and additional content below.Recommended textbooks for you

Algebra & Trigonometry with Analytic Geometry
Algebra
ISBN:
9781133382119
Author:
Swokowski
Publisher:
Cengage

College Algebra (MindTap Course List)
Algebra
ISBN:
9781305652231
Author:
R. David Gustafson, Jeff Hughes
Publisher:
Cengage Learning
Algebra & Trigonometry with Analytic Geometry
Algebra
ISBN:
9781133382119
Author:
Swokowski
Publisher:
Cengage
College Algebra (MindTap Course List)
Algebra
ISBN:
9781305652231
Author:
R. David Gustafson, Jeff Hughes
Publisher:
Cengage Learning

Elements Of Modern Algebra
Algebra
ISBN:
9781285463230
Author:
Gilbert, Linda, Jimmie
Publisher:
Cengage Learning,

Functions and Change: A Modeling Approach to Coll…
Algebra
ISBN:
9781337111348
Author:
Bruce Crauder, Benny Evans, Alan Noell
Publisher:
Cengage Learning