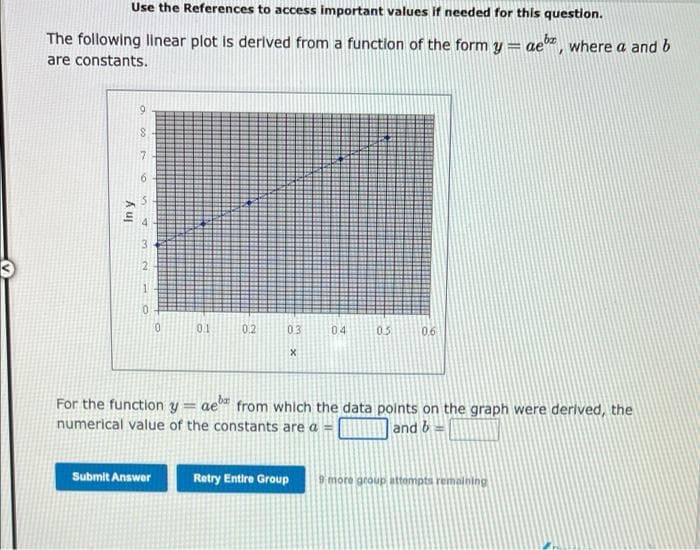
The following Ilinear plot is derived from a function of the form y= ae", where a and b %3D are constants. 7. 6. 2. 0.1 0.2 03 04 0. 0.6 For the function y= ae™ from which the data points on the graph were derived, the numerical value of the constants are a = %3D and b In y


Q: You have the following data points which belong to a function of the form y = ae, where b can be…
A:
Q: 16. The following scatter plot graphs the average final grade students received in Introduction to…
A: Here, Y= final grades X= absent (number of days) Graph is given, we have to answer for mentioned…
Q: Q4 As a factory manager, you are concem about the health of your workers. In this regard, you have…
A: Q4. Let x be the working temperature and y be the water consumption. The scatter plot is obtained…
Q: The time of arrival of an artificial seismic wave versus the distance from the source is given in…
A: Given: Distance (m) Time (sec) 530 0.349 600 0.391 670 0.441 1130 0.739 1200 0.787…
Q: A study was done to determine if the time of day affected the per certain Algebra class, The same…
A:
Q: Use a graphing utility to find the line of best fit for the following data. y 9. 13 12 15 17 20 The…
A:
Q: Fit a straight line to the following data and estimate the production in the year 1957. YEAR:…
A:
Q: The annual precipitation data (mm) recorded at Kumköy, Istanbul in period 1952-1990 are given below:…
A: Since you have posted a question with multiple sub-parts, we will solve first three sub-parts for…
Q: Find the curve of fit of the type y = ae* to the following data 1 5 7 9. 12 y 10 15 12 15 21
A: The regression is a method of machine learning under subgroup Supervised Learning. The regression…
Q: 3 The following table contains the ACT scores and the GPA (grade point average) for eight college…
A: Hello. Since your question has multiple sub-parts, we will solve first three sub-parts for you. If…
Q: The table below sflows data from a study relating a man's age to the average number of miles he can…
A: We will use graphing calculator to find best fit for these data Let x = men's age and y = average…
Q: A sample of 15, 10 years old children was taken to study whether watching television reduces the…
A: The appropriate plot to investigate the relationship between Television (hours) and Overweight (Kg)…
Q: 3. Fit a curve of the type y = bx™ to the following data: (2, 27.8), (3, 62.1), (4, 110), and (5,…
A: We fit a curve of the type y = bxm to the following data : ( 2 , 27.8 ) , ( 3 , 62.1 ) , ( 4 , 110 )…
Q: In a sample of 300 steel rods, the correlation coefficient between diameter and length was r = 0.15.…
A: Given Information No of steel rods = 300 correlation coefficient between diameter and length is r =…
Q: The following linear plot is derived from a function of the form y = ae*, where a and b are…
A:
Q: We want to predict the selling price of a house in Newburg Park, Florida, based on the distance the…
A:
Q: We want to predict the selling price of a house in Newburg Park, Florida, based on the distance the…
A: The independent variable is distance from the beach. The dependent variable is selling price. This…
Q: - The accompanying data on x = head circumfer- core (a comparison score with peers of the same…
A: a. Scatterplot: Steps to construct scatter plot in Excel: Enter the data for x and y in Excel sheet…
Q: A baseball is thrown upward, and its height measured at 0.5-second intervals using a strobe light.…
A: Given data is Time (s) Height (feet) 0 4.2 0.5 26.1 1.0 40.1 1.5 46.0 2.0 43.9 2.5…
Q: Q2: the following frequency table represent the wages for group of employees per week in JD Mid…
A: Frequency Distribution: Frequency distribution displays the frequency of various…
Q: A sample of 10 people ingested a new formulation of a new drug. Six hours later, the concentrations…
A: Dot plot:It is a variation in bar chart in which dots are used instead of bars to represent the…
Q: The table below shows the velocity of a child sliding down a giant "Water Splash". 0. 3.9 10 8. Time…
A: Part (a) The velocity time graph by connecting the data points is shown below.
Q: The following scatter plot displays data for Mileage (x) and Price ((y). Answer the questions below…
A: Given regression equation, y=-0.1264x+15624 r=-0.8884 r2=0.7892
Q: The calcium (Ca) content of a powdered mineral substance was analyzed 10 times with the following…
A: Given that,0.271 0.282 0.279 0.281 0.2680.271 0.281 0.269 0.275 0.276
Q: Q4. By plotting the graph of the given data mention whether there is a positive trend, negative…
A:
Q: 15 From the data given below find out the value of Y when X=35 10 20 30 40 Y 50 60 70 90 joL
A:
Q: Which functions may have been used to generate the following plot and its underlying data? a) lm()…
A: a) lm() function is used to create regression model. b) points() function is used to plot the…
Q: A baseball is thrown upward, and its height measured at 0.5-second intervals using a strobe light.…
A: Given that, A baseball is thrown upward, and its height is measured at 0.5-second intervals using…
Q: Plot the following data using proper graphing techniques. (Hint: P depends on T) Temperature…
A: as per guidelines, we can only do a maximum 3 part of the question if you want all please ask them…
Q: You have the following data points which belong to a function of the form y = ae7, where b can be…
A: Let's find.
Q: The following graph is a standard curve based on the concentrations (in ppm) of the standards…
A: Given the instrument response = 0.8 We will draw lines parallel to the x-axis (as shown in below…
Q: The accompanying data file contains 10 observations for tand ye oicture Click here for the Excel…
A:
Q: Flavia wanted to know if the first sample quartile (or Q1) was an unbiased estimator of the first…
A: Given that Q=70
Q: Sheet 2 (Home Size): In a given community, a survey was conducted to determine - whether there is…
A: The provided information is x y xy x2 41.2 2.9 119.48 1697.44 68.3 3.5 239.05 4664.89 22.4…
Q: Q1: The data points below are related to a chemi-thermo-mechanical pulp from mixed density…
A: As we are authorized to answer only 3 subparts for each question and that you haven't specified…
Q: The data represented in the scatterplot below is not related to the previous question. Based on the…
A: The given scatterplot explains the relationship between two variables in which one variable is smart…
Q: Q4. Dr. Ahmad has noticed many of his students have been absent from class this semester. He feels…
A: The following information has been provided: x y 5 2 6 2 2 4 0 5 9 4 12 2 16 5 5…
Q: Jóhannes plans to examine the salary of a middle manager in a large company. He collects data on…
A: Hello. Since your question has multiple sub-parts, we will solve first three sub-parts for you. If…
Q: In a certain type of metal test specimen, the normal stress on a specimen is known to be…
A: Solution-: Let, X=Normal stress, Y=Shear Resistance We find, (1) Graph the scatter diagram. (2)…
Q: The residual plots from two different sets of data are graphed below. 0.61 51 0.4- 4- 0.2 3 어 6. 8.…
A: It is often difficult to determine from diagnostic plots such as the one in graph A for the plasma…
Q: Q.3. The annual precipitation data (mm) recorded at Kumköy, Istanbul in period 1952-1990 are given…
A: Since you have posted a question with multiple sub-parts, we will solve first three subparts for…
Q: Use the data as given in the problem and answer the following questions. The data shows the opening…
A: As per our guidelines we can solve first three subpart and rest can be reposted. Solution-: (1) Draw…
Q: The diameter of iron rods issued in a high rising building pillars are under investigation. The…
A: The data are given i) for the interquartile range first we calculate first quartile and third…
Q: Q1/ A// Determine the relative cumulative frequency for the data below. Class 0-10 10-20 20-30 30-40…
A: A relative frequency is the ratio of the number of times a value of the data occurs in the set of…
Q: For the following example indicate the type of data involved using the following: A = nominal data…
A: Scale of measurement used to measure the variable. It is used to measure the discrete and continuous…
Q: vould you expect in a normal quantile plot of these data? e histogram would be approximately…
A: A histogram is a graphical representation of the distribution of numerical data. For a population…
Q: You have the following data points which belong to a function of the form y = ae, where b can be…
A:
Q: We want to predict the selling price of a house in Newburg Park, Florida, based on the distance the…
A: Given: Sample size n = 15 Slope b = -4.73 Formula Used: Y-intercept a = ∑Y-b∑Xn Sample correlation…
Q: The following table lists the calories per 100 milliliters of 25 popular beers. Construct a…
A: Arrange the given data in ascending order26, 32 , 36, 36 , 37 , 39, 39, 40, 40, 41, 42, 42,43, 45,…
Q: You have the following data points which belong to a function of the form y = ae, where b can be…
A:


Trending now
This is a popular solution!

Step by step
Solved in 2 steps with 2 images

- Find the equation of the regression line for the following data set. x 1 2 3 y 0 3 4bThe average rate of change of the linear function f(x)=3x+5 between any two points is ________.Below is solution to question 6, I need answer for question 7 Estimated regression line and coefficient of determination is:- y = 0.0041x + 0.0082R² = 0.0845 The estimated slope coefficient is positive, which is consistent with the CAPM. The estimated intercept is positive, which is consistent with the CAPM. Option a and c are correct.
- A particular professor has noticed that the number of people, P, who complain about his attitude is dependent on the number of cups of coffee, n, he drinks. From eight days of tracking he compiled the following data: People (P) 11 11 9 10 8 7 7 4 Cups of coffee (n) 1 1 2 3 3 4 4 5 Unless otherwise stated, you can round values to two decimal places.a) Using regression to find a linear equation for P(n)P(n)P(n) = b) Interpret the meaning of the slope of your formula in the context of the problemc) Interpret the meaning of the P intercept in the context of the problemd) Use your model to predict the number of people that will complain about his attitude if he drinks 9 cups of coffee. e) Is the answer to part f reasonable? Why or why not?f) How many cups of coffee should he drink so that no one will complain about his attitude? It is ok to round to one decimal place.Here is data with y as the response variable. x y 43.7 85.5 32.3 95.9 61.5 68.4 37.5 85.7 39.2 80.9 50.8 82.5 47.7 81.4 -69.9 90.7 57.6 77.1 57.2 71.8 Make a scatter plot of this data. Which point is an outlier? Enter as an ordered pair. For example (a,b) - with parenthesis.Find the regression equation for the data set without the outlier. Enter as an equation of the form y=a+bxy=a+bx. Rounded to three decimal places. Do not include the hat in y-hat.Find the regression equation for the data set with the outlier. Enter as an equation of the form y=a+bxy=a+bx. Rounded to three decimal places. Do not include the hat in y-hat.Is this outlier an influential point? Yes, the outlier appears to be an influential point. No, the outlier does not appear to be an influential point.Is the magnitude of an earthquake related to the depth below the surface at which the quake occurs? Let x be the magnitude of an earthquake (on the Richter scale), and let y be the depth (in kilometers) of the quake below the surface at the epicenter. x 3.4 4.7 3.3 4.5 2.6 3.2 3.4 y 5.4 10.0 11.2 10.0 7.9 3.9 5.5 (a) Make a scatter diagram of the data. Then visualize the line you think best fits the data. Use a calculator to verify that Σx = 25.1, Σx2 = 93.35, Σy = 53.9, Σy2 = 462.47 and Σxy = 199.04. Compute r. (Round your answer to four decimal places.) As x increases, does the value of r imply that y should tend to increase or decrease? Explain your answer. Given our value of r, y should tend to increase as x increases. Given our value of r, y should tend to remain constant as x increases. Given our value of r, y should tend to decrease as x increases. Given our value of r, we can not draw any conclusions for the behavior of y as x increases.
- A particular professor has noticed that the number of people, P, who complain about his attitude is dependent on the number of cups of coffee, n, he drinks. From eight days of tracking he compiled the following data: People (P) 10 11 9 8 8 6 3 3 Cups of coffee (n) 1 1 2 2 3 4 5 5 Unless otherwise stated, you can round values to two decimal places.a) Using regression to find a linear equation for P(n)P(n)=b) Interpret the meaning of the slope of your formula in the context of the problemc) Interpret the meaning of the P intercept in the context of the problemd) Use your model to predict the number of people that will complain about his attitude if he drinks 9 cups of coffee.e) Is the answer to part f reasonable? Why or why not?f) How many cups of coffee should he drink so that no one will complain about his attitude? It is ok to round to one decimal place.Here is data with y as the response variable. x y 48.2 48.5 43.2 51.4 40.4 55.1 36.8 60.9 47.5 50.9 107.5 44.9 52.5 41.2 43.9 55 1)Make a scatter plot of this data. Which point is an outlier? ____Enter as an ordered pair. For example (a,b) - with parenthesis.2)Find the regression equation for the data set without the outlier. _______ Enter as an equation of the form y=a+bxy=a+bx. Rounded to three decimal places. Do not include the hat in y-hat.3)Find the regression equation for the data set with the outlier. _____ Enter as an equation of the form y=a+bxy=a+bx. Rounded to three decimal places. Do not include the hat in y-hat.Which functions may have been used to generate the following plot and its underlying data? a) lm()b) points()c) abline()d) integrate()
- A particular professor has noticed that the number of people, P, who complain about his attitude is dependent on the number of cups of coffee, n, he drinks. From eight days of tracking he compiled the following data: People (P) 10 10 9 7 8 5 4 4 Cups of coffee (n) 1 1 2 3 3 4 5 5 Unless otherwise stated, you can round values to two decimal places.a) Using regression to find a linear equation for P(n)P(n) = b) Interpret the meaning of the slope of your formula in the context of the problemc) Interpret the meaning of the P intercept in the context of the problemd) Use your model to predict the number of people that will complain about his attitude if he drinks 8 cups of coffee.(Round to 2 decimals) e) Is the answer to part d reasonable? Why or why not?f) How many cups of coffee should he drink so that no one will complain about his attitude? It is ok to round to one decimal place.Here is data with y as the response variable. x y 15.9 20.7 9.9 -3.2 41.7 38.9 -101.4 2 34.8 34.1 25.1 7.1 19.3 8.3 24 33.8 Make a scatter plot of this data. Which point is an outlier? Enter as an ordered pair. For example (a,b) - with parenthesis.Find the regression equation for the data set without the outlier. Enter as an equation of the form y=a+bxy=a+bx. Rounded to three decimal places. Do not include the hat in y-hat. Find the regression equation for the data set with the outlier. Enter as an equation of the form y=a+bxy=a+bx. Rounded to three decimal places. Do not include the hat in y-hat.The accompanying data are the length (in centimeters) and girths (in centimeters) of 12 harbor seals. Find the equation of the regression line. Then construct a scatter plot of the data and draw the regression line. Then use the regression equation to predict the value of y for each of the given x-values, if meaningful. If the x-value is not meaningful to predict the value of y, explain why not. (a) x=140 cm (b) x=172 cm (c) x=164 cm (d) x=158 cm Length, x Girth, y136 107168 130152 115145 107159 126160 120124 103137 104154 119149 109146 106145 108 The equation of the regression line is y= ____x+________ Plot .


