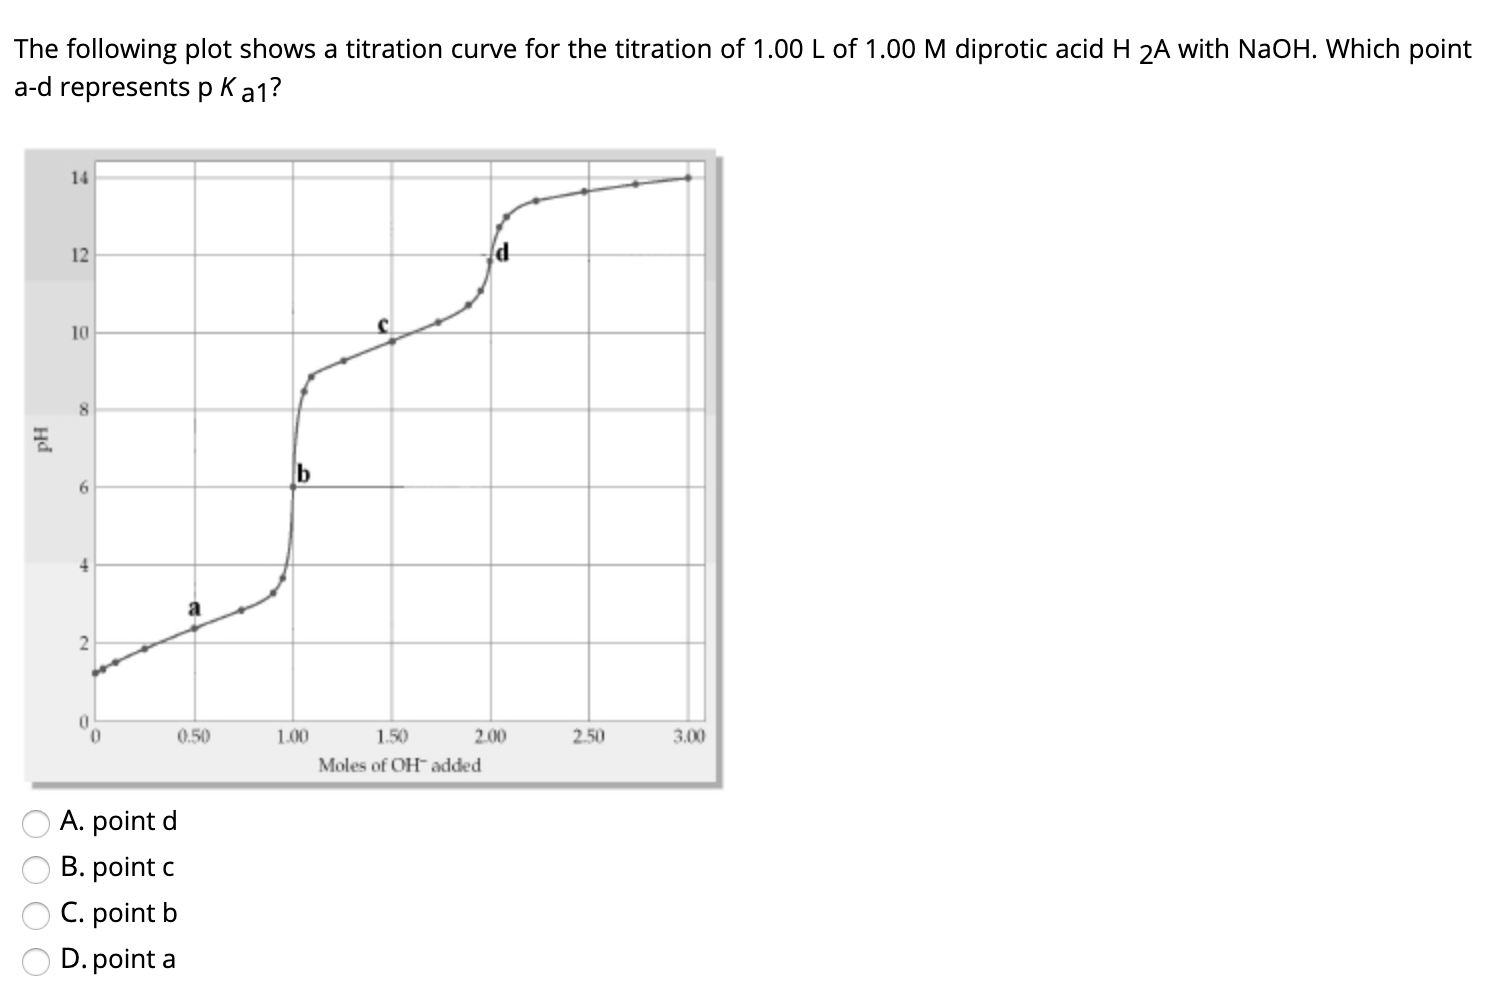
The following plot shows a titration curve for the titration of 1.00 L of 1.00 M diprotic acid H 2A with NaOH. Which point a-d representspKa1? 14 12 10 8. 0. 0.50 1.00 1.50 2.00 2.50 3.00 Moles of OH added A. point d B. point c C. point b D. point a на
The following plot shows a titration curve for the titration of 1.00 L of 1.00 M diprotic acid H 2A with NaOH. Which point a-d representspKa1? 14 12 10 8. 0. 0.50 1.00 1.50 2.00 2.50 3.00 Moles of OH added A. point d B. point c C. point b D. point a на

Chemistry: An Atoms First Approach
2nd Edition
ISBN:9781305079243
Author:Steven S. Zumdahl, Susan A. Zumdahl
Publisher:Steven S. Zumdahl, Susan A. Zumdahl
Chapter14: Acid- Base Equilibria
Section: Chapter Questions
Problem 64E: Repeat the procedure in Exercise 61, but for the titration of 25.0 mL of 0.100 M pyridine with 0.100...

Related questions
Question
Transcribed Image Text:The following plot shows a titration curve for the titration of 1.00 L of 1.00 M diprotic acid H 2A with NaOH. Which point
a-d representspKa1?
14
12
10
8.
0.
0.50
1.00
1.50
2.00
2.50
3.00
Moles of OH added
A. point d
B. point c
C. point b
D. point a
на
Expert Solution
This question has been solved!
Explore an expertly crafted, step-by-step solution for a thorough understanding of key concepts.

This is a popular solution!

Trending now
This is a popular solution!

Step by step
Solved in 3 steps with 1 images

Recommended textbooks for you
Chemistry: An Atoms First Approach
Chemistry
ISBN:
9781305079243
Author:
Steven S. Zumdahl, Susan A. Zumdahl
Publisher:
Cengage Learning


Chemistry
Chemistry
ISBN:
9781305957404
Author:
Steven S. Zumdahl, Susan A. Zumdahl, Donald J. DeCoste
Publisher:
Cengage Learning
Chemistry: An Atoms First Approach
Chemistry
ISBN:
9781305079243
Author:
Steven S. Zumdahl, Susan A. Zumdahl
Publisher:
Cengage Learning
Chemistry
Chemistry
ISBN:
9781305957404
Author:
Steven S. Zumdahl, Susan A. Zumdahl, Donald J. DeCoste
Publisher:
Cengage Learning


Chemistry: Principles and Practice
Chemistry
ISBN:
9780534420123
Author:
Daniel L. Reger, Scott R. Goode, David W. Ball, Edward Mercer
Publisher:
Cengage Learning