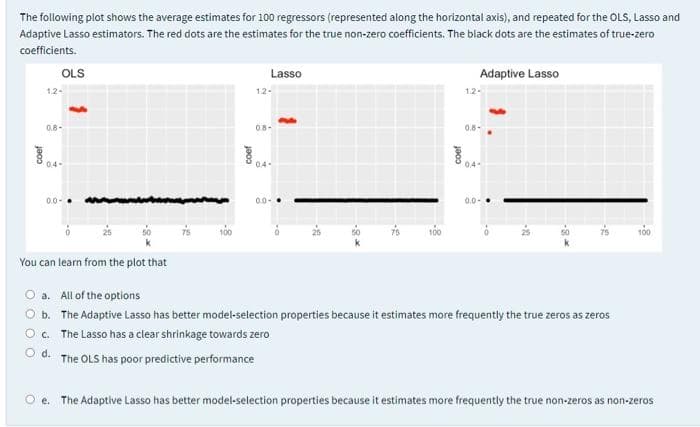
The following plot shows the average estimates for 100 regressors (represented along the horizontal axis), and repeated for the OLS, Lasso and Adaptive Lasso estimators. The red dots are the estimates for the true non-zero coefficients. The black dots are the estimates of true-zero coefficients. OLS Lasso Adaptive Lasso 1.2- 12- 1.2 0.8- 08- 0.8- 04- 04- 04- 0.0-. 0- 0.0-. 100 You can learn from the plot that O a. All of the options O b. The Adaptive Lasso has better model-selection properties because it estimates more frequently the true zeros as zeros O. The Lasso has a clear shrinkage towards zero O d. The OLS has poor predictive performance e. The Adaptive Lasso has better model-selection properties because it estimates more frequently the true non-zeros as non-zeros
The following plot shows the average estimates for 100 regressors (represented along the horizontal axis), and repeated for the OLS, Lasso and Adaptive Lasso estimators. The red dots are the estimates for the true non-zero coefficients. The black dots are the estimates of true-zero coefficients. OLS Lasso Adaptive Lasso 1.2- 12- 1.2 0.8- 08- 0.8- 04- 04- 04- 0.0-. 0- 0.0-. 100 You can learn from the plot that O a. All of the options O b. The Adaptive Lasso has better model-selection properties because it estimates more frequently the true zeros as zeros O. The Lasso has a clear shrinkage towards zero O d. The OLS has poor predictive performance e. The Adaptive Lasso has better model-selection properties because it estimates more frequently the true non-zeros as non-zeros

Linear Algebra: A Modern Introduction
4th Edition
ISBN:9781285463247
Author:David Poole
Publisher:David Poole
Chapter7: Distance And Approximation
Section7.3: Least Squares Approximation
Problem 31EQ

Related questions
Question
6
Transcribed Image Text:The following plot shows the average estimates for 100 regressors (represented along the horizontal axis), and repeated for the OLS, Lasso and
Adaptive Lasso estimators. The red dots are the estimates for the true non-zero coefficients. The black dots are the estimates of true-zero
coefficients.
OLS
Lasso
Adaptive Lasso
12-
12-
1.2-
0.8-
08-
0.8-
04-
04-
04-
00-.
00
0.0-.
100
75
100
100
You can learn from the plot that
a. All of the options
b. The Adaptive Lasso has better model-selection properties because it estimates more frequently the true zeros as zeros
O. The Lasso has a clear shrinkage towards zero
O d. The OLS has poor predictive performance
e. The Adaptive Lasso has better model-selection properties because it estimates more frequently the true non-zeros as non-zeros
-8
Expert Solution
This question has been solved!
Explore an expertly crafted, step-by-step solution for a thorough understanding of key concepts.

Step by step
Solved in 3 steps

Recommended textbooks for you
Linear Algebra: A Modern Introduction
Algebra
ISBN:
9781285463247
Author:
David Poole
Publisher:
Cengage Learning

Glencoe Algebra 1, Student Edition, 9780079039897…
Algebra
ISBN:
9780079039897
Author:
Carter
Publisher:
McGraw Hill
Linear Algebra: A Modern Introduction
Algebra
ISBN:
9781285463247
Author:
David Poole
Publisher:
Cengage Learning
Glencoe Algebra 1, Student Edition, 9780079039897…
Algebra
ISBN:
9780079039897
Author:
Carter
Publisher:
McGraw Hill