The following probability distributions of job satisfaction scores for a sample of information systems (IS) senior executives range from a low of 1 (very dissatisfied) to a high of 5 (very satisfied). Excel File: data05-21.xlsx Job Satisfaction Score 123 45 Executives 5 Middle managers IS Senlor Executives 0.05 0.09 0.03 0.42 0.41 Probability a. What is the expected value of the job satisfaction score for senior executives (to 2 decimals)? IS Middle Managers 0.04 0.10 0.12 0.46 0.28 b. What is the expected value of the job satisfaction score for middle managers (to 2 decimals)? c. Compute the variance of job satisfaction scores for executives and middle managers (to 2 decimals).
The following probability distributions of job satisfaction scores for a sample of information systems (IS) senior executives range from a low of 1 (very dissatisfied) to a high of 5 (very satisfied). Excel File: data05-21.xlsx Job Satisfaction Score 123 45 Executives 5 Middle managers IS Senlor Executives 0.05 0.09 0.03 0.42 0.41 Probability a. What is the expected value of the job satisfaction score for senior executives (to 2 decimals)? IS Middle Managers 0.04 0.10 0.12 0.46 0.28 b. What is the expected value of the job satisfaction score for middle managers (to 2 decimals)? c. Compute the variance of job satisfaction scores for executives and middle managers (to 2 decimals).

College Algebra
7th Edition
ISBN:9781305115545
Author:James Stewart, Lothar Redlin, Saleem Watson
Publisher:James Stewart, Lothar Redlin, Saleem Watson
Chapter9: Counting And Probability
Section9.3: Binomial Probability
Problem 33E: Sick leave probability that a given worker at Dyno Nutrition Will call in sick on a Monday is 004....

Related questions
Question
Transcribed Image Text:ssignment
O
O
O
O
e
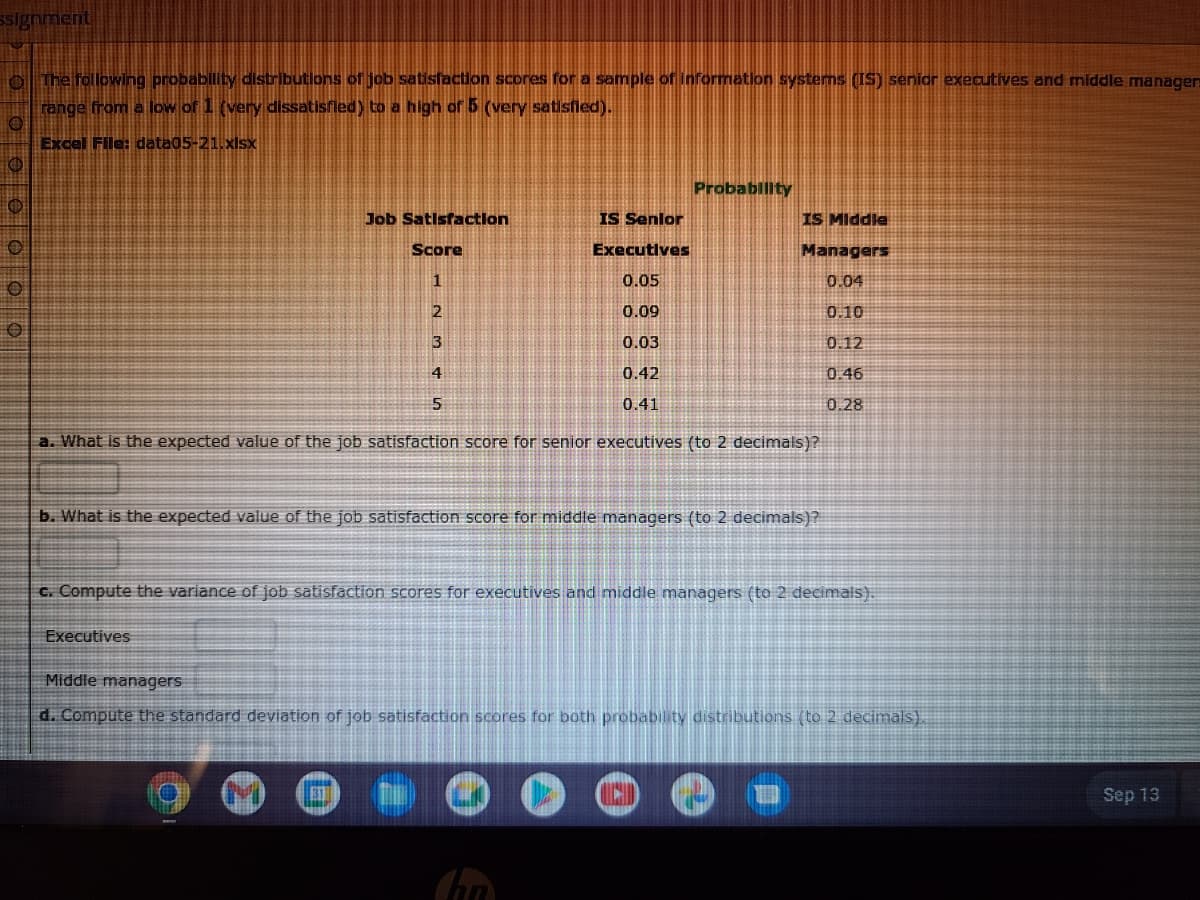
The following probability distributions of job satisfaction scores for a sample of information systems (IS) senior executives and middle manager
range from a low of 1 (very dissatisfied) to a high of 5 (very satisfied).
Excel File: data05-21.xlsx
Job Satisfaction
Score
723 45
IS Senlor
Executives
0.05
0.09
0.03
0.42
0.41
Executives
Probability
IS Middle
Managers
0.04
0.10
0.12
0.46
0.28
a. What is the expected value of the job satisfaction score for senior executives (to 2 decimals)?
b. What is the expected value of the job satisfaction score for middle managers (to 2 decimals)?
c. Compute the variance of job satisfaction scores for executives and middle managers (to 2 decimals).
Middle managers
d. Compute the standard deviation of job satisfaction scores for both probability distributions (to 2 decimals).
Sep 13
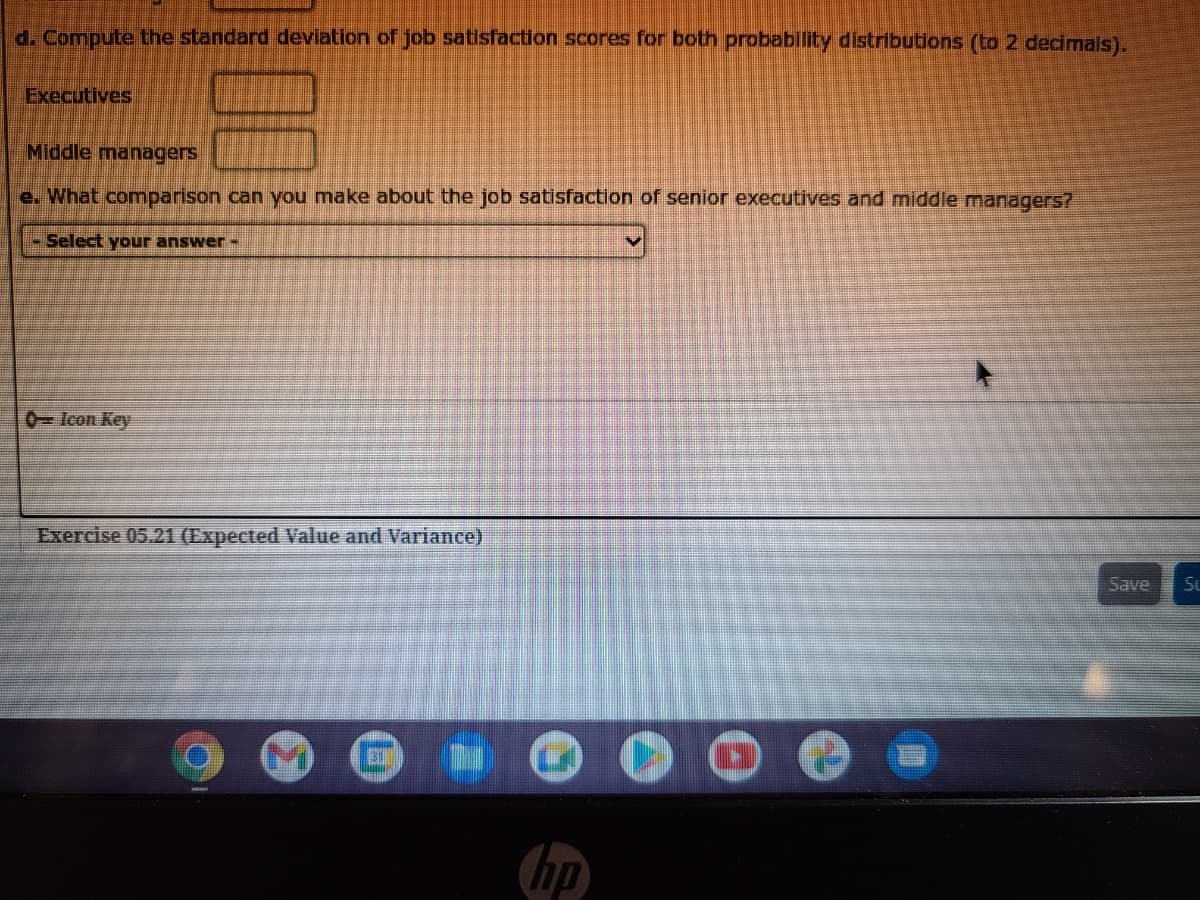
Transcribed Image Text:d. Compute the standard deviation of job satisfaction scores for both probability distributions (to 2 decimals).
Executives
Middle managers
e. What comparison can you make about the job satisfaction of senior executives and middle managers?
- Select your answer -
0-Icon Key
Exercise 05.21 (Expected Value and Variance)
Umme
hp
►
Save
Su
Expert Solution
This question has been solved!
Explore an expertly crafted, step-by-step solution for a thorough understanding of key concepts.

This is a popular solution!

Trending now
This is a popular solution!

Step by step
Solved in 2 steps

Recommended textbooks for you
College Algebra
Algebra
ISBN:
9781305115545
Author:
James Stewart, Lothar Redlin, Saleem Watson
Publisher:
Cengage Learning


College Algebra
Algebra
ISBN:
9781305115545
Author:
James Stewart, Lothar Redlin, Saleem Watson
Publisher:
Cengage Learning