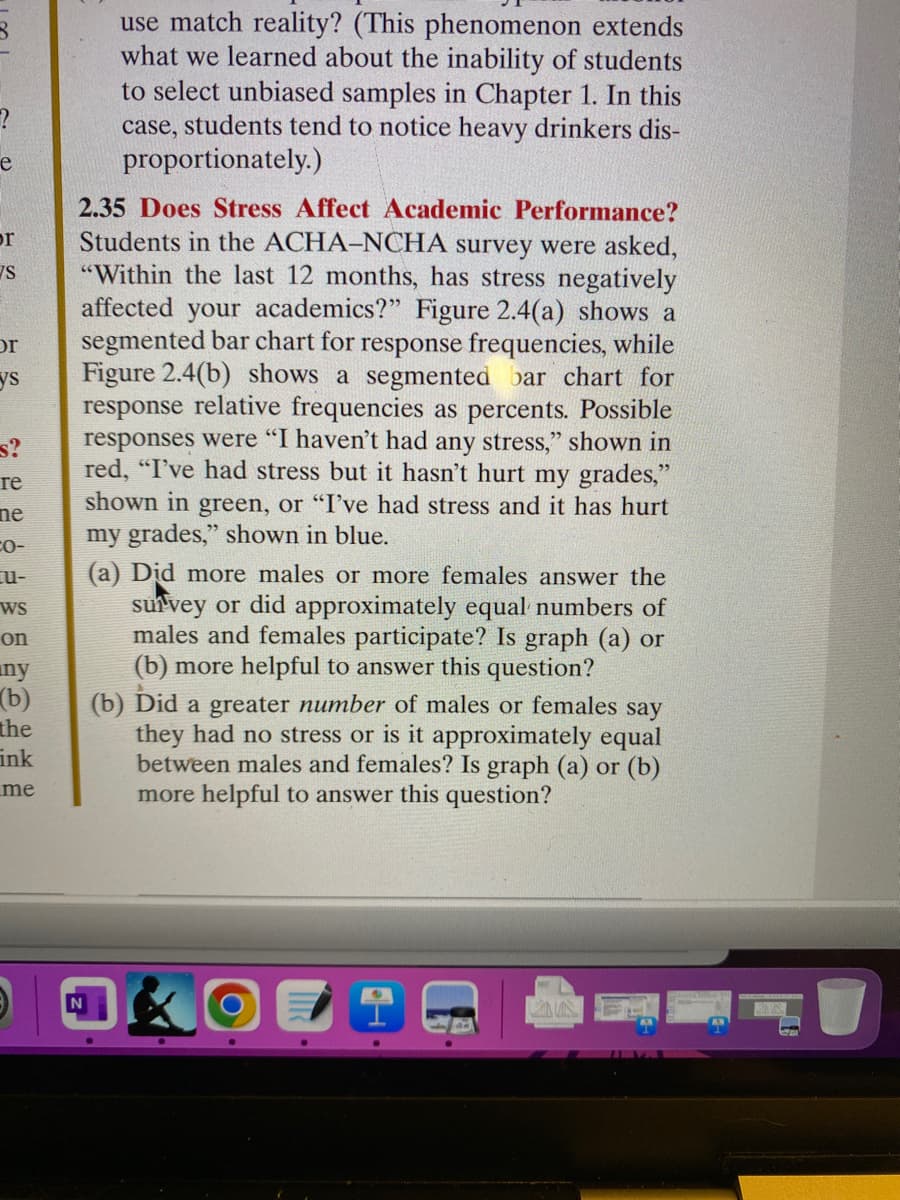
2.35 Does Stress Affect Academic Performance? Students in the ACHA-NCHA survey were asked, "Within the last 12 months, has stress negatively affected your academics?" Figure 2.4(a) shows a segmented bar chart for response frequencies, while Figure 2.4(b) shows a segmented bar chart for response relative frequencies as percents. Possible responses were "I haven't had any stress," shown in red, "I've had stress but it hasn't hurt my grades," shown in green, or "I've had stress and it has hurt my grades," shown in blue. (a) Did more males or more females answer the survey or did approximately equal numbers of males and females participate? Is graph (a) or (b) more helpful to answer this question? (b) Did a greater number of males or females say they had no stress or is it approximately equal between males and females? Is graph (a) or (b) more helpful to answer this question?
2.35 Does Stress Affect Academic Performance? Students in the ACHA-NCHA survey were asked, "Within the last 12 months, has stress negatively affected your academics?" Figure 2.4(a) shows a segmented bar chart for response frequencies, while Figure 2.4(b) shows a segmented bar chart for response relative frequencies as percents. Possible responses were "I haven't had any stress," shown in red, "I've had stress but it hasn't hurt my grades," shown in green, or "I've had stress and it has hurt my grades," shown in blue. (a) Did more males or more females answer the survey or did approximately equal numbers of males and females participate? Is graph (a) or (b) more helpful to answer this question? (b) Did a greater number of males or females say they had no stress or is it approximately equal between males and females? Is graph (a) or (b) more helpful to answer this question?

College Algebra (MindTap Course List)
12th Edition
ISBN:9781305652231
Author:R. David Gustafson, Jeff Hughes
Publisher:R. David Gustafson, Jeff Hughes
Chapter8: Sequences, Series, And Probability
Section8.7: Probability
Problem 58E: What is meant by the sample space of an experiment?

Related questions
Question
Can you help explain 2.35? Thank you
Transcribed Image Text:?
e
or
VS
or
ys
s?
re
ne
CO-
u-
WS
on
ny
(b)
the
ink
me
use match reality? (This phenomenon extends
what we learned about the inability of students
to select unbiased samples in Chapter 1. In this
case, students tend to notice heavy drinkers dis-
proportionately.)
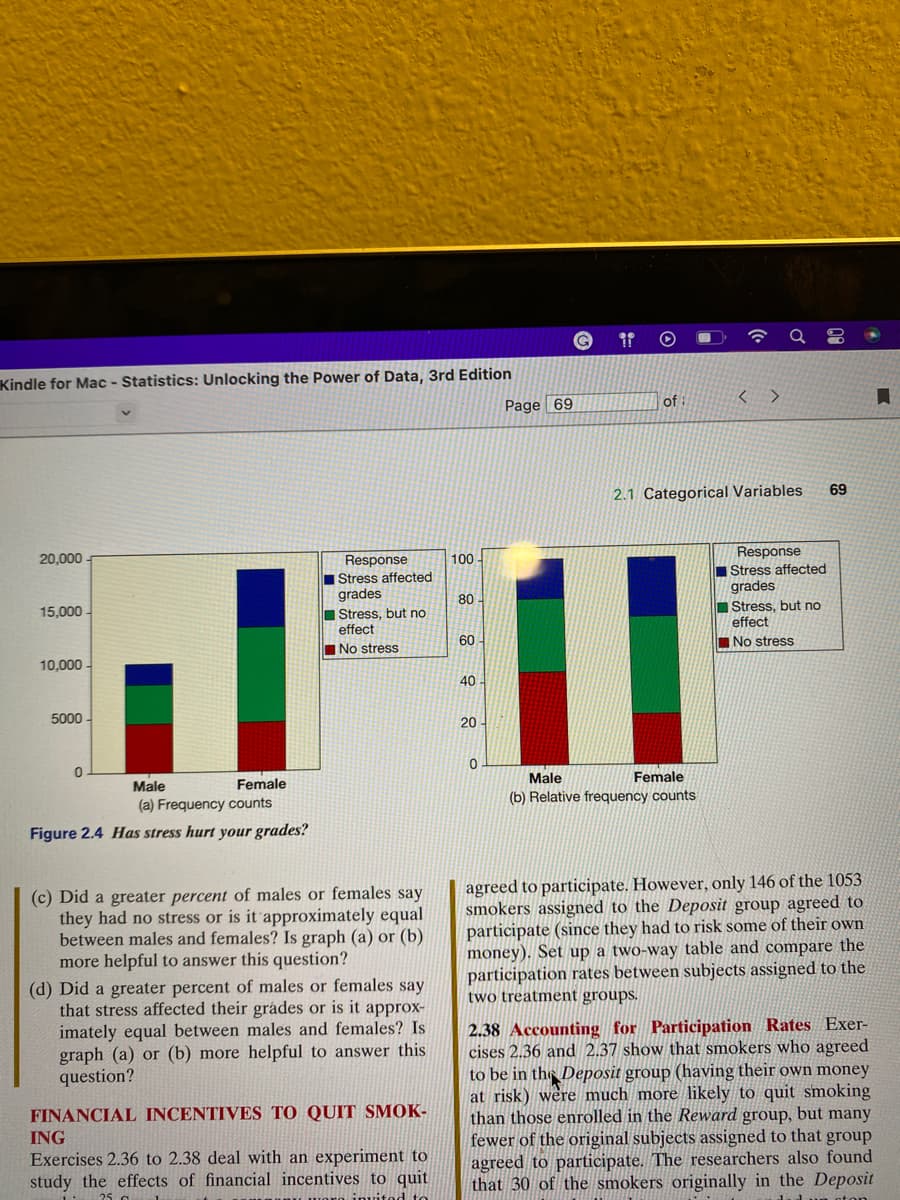
2.35 Does Stress Affect Academic Performance?
Students in the ACHA-NCHA survey were asked,
"Within the last 12 months, has stress negatively
affected your academics?" Figure 2.4(a) shows a
segmented bar chart for response frequencies, while
Figure 2.4(b) shows a segmented bar chart for
response relative frequencies as percents. Possible
responses were "I haven't had any stress," shown in
red, "I've had stress but it hasn't hurt my grades,"
shown in green, or "I've had stress and it has hurt
my grades," shown in blue.
(a) Did more males or more females answer the
survey or did approximately equal numbers of
males and females participate? Is graph (a) or
(b) more helpful to answer this question?
(b) Did a greater number of males or females say
they had no stress or is it approximately equal
between males and females? Is graph (a) or (b)
more helpful to answer this question?
9
Transcribed Image Text:Kindle for Mac - Statistics: Unlocking the Power of Data, 3rd Edition
20,000
15,000
10,000
5000-
0
Female
Male
(a) Frequency counts
Figure 2.4 Has stress hurt your grades?
Response
Stress affected
grades
Stress, but no
effect
No stress
(c) Did a greater percent of males or females say
they had no stress or is it approximately equal
between males and females? Is graph (a) or (b)
more helpful to answer this question?
(d) Did a greater percent of males or females say
that stress affected their grades or is it approx-
imately equal between males and females? Is
graph (a) or (b) more helpful to answer this
question?
FINANCIAL INCENTIVES TO QUIT SMOK-
ING
Exercises 2.36 to 2.38 deal with an experiment to
study the effects of financial incentives to quit
25
100
80
60-
40
20
0
Page 69
G
9⁹ O
of
2.1 Categorical Variables
Male
Female
(b) Relative frequency counts
Response
Stress affected
grades
Stress, but no
effect
No stress
69
agreed to participate. However, only 146 of the 1053
smokers assigned to the Deposit group agreed to
participate (since they had to risk some of their own
money). Set up a two-way table and compare the
participation rates between subjects assigned to the
two treatment groups.
↓
2.38 Accounting for Participation Rates Exer-
cises 2.36 and 2.37 show that smokers who agreed
to be in the Deposit group (having their own money
at risk) were much more likely to quit smoking
than those enrolled in the Reward group, but many
fewer of the original subjects assigned to that group
agreed to participate. The researchers also found
that 30 of the smokers originally in the Deposit
Jumaton
Expert Solution
This question has been solved!
Explore an expertly crafted, step-by-step solution for a thorough understanding of key concepts.

Step by step
Solved in 5 steps

Recommended textbooks for you
College Algebra (MindTap Course List)
Algebra
ISBN:
9781305652231
Author:
R. David Gustafson, Jeff Hughes
Publisher:
Cengage Learning
College Algebra (MindTap Course List)
Algebra
ISBN:
9781305652231
Author:
R. David Gustafson, Jeff Hughes
Publisher:
Cengage Learning