The following regression output is for predicting the heart weight (in g) of cats from their body weight (in kg). The coecients are estimated using a dataset of 144 domestic cats. 20- 15 5- 2.0 2.5 3.0 3.5 4.0 Body weight (kg) Estimate Std. Error -0.357 t value Pr(>t|) -0.515 (Intercept) body wt s = 1.452 0.692 0.607 4.034 0.250 16.119 0.000 R = 64.66% R = 64.41% a) Write out the linear model. y- -0.357 b) Interpret the intercept. 4.034 poverty % Expected heart weight of cats with no body weight is 4.034 kg Expected body weight of cats with no heart weight is 4.034 g For each additional 1 g increase in heart weight, we expect body weight to decrease by 0.357 kg For each additional 1g increase in heart weight, we expect body weight to increase by 0.357 kg For each additional 1 g increase in heart weight, we expect body weight to increase by 4.034 kg Expected heart weight of cats with no body weight is -0.357 kg Expected body weight of cats with no heart weight is -0.357 g For each additional 1 kg increase in body weight, we expect heart weight to decrease by 0.357 g Heart weight )
The following regression output is for predicting the heart weight (in g) of cats from their body weight (in kg). The coecients are estimated using a dataset of 144 domestic cats. 20- 15 5- 2.0 2.5 3.0 3.5 4.0 Body weight (kg) Estimate Std. Error -0.357 t value Pr(>t|) -0.515 (Intercept) body wt s = 1.452 0.692 0.607 4.034 0.250 16.119 0.000 R = 64.66% R = 64.41% a) Write out the linear model. y- -0.357 b) Interpret the intercept. 4.034 poverty % Expected heart weight of cats with no body weight is 4.034 kg Expected body weight of cats with no heart weight is 4.034 g For each additional 1 g increase in heart weight, we expect body weight to decrease by 0.357 kg For each additional 1g increase in heart weight, we expect body weight to increase by 0.357 kg For each additional 1 g increase in heart weight, we expect body weight to increase by 4.034 kg Expected heart weight of cats with no body weight is -0.357 kg Expected body weight of cats with no heart weight is -0.357 g For each additional 1 kg increase in body weight, we expect heart weight to decrease by 0.357 g Heart weight )

College Algebra
7th Edition
ISBN:9781305115545
Author:James Stewart, Lothar Redlin, Saleem Watson
Publisher:James Stewart, Lothar Redlin, Saleem Watson
Chapter1: Equations And Graphs
Section: Chapter Questions
Problem 10T: Olympic Pole Vault The graph in Figure 7 indicates that in recent years the winning Olympic men’s...

Related questions
Question
![The following regression output is for predicting the heart weight (in g) of cats from
their body weight (in kg). The coecients are estimated using a dataset of 144
domestic cats.
20-
15-
5-
2.0
2.5
3.0
3.5
4.0
Body weight (kg)
Std. Error
Pr(>[t])
0.607
Estimate
t value
(Intercept)
body wt
-0.357
0.692
-0.515
4.034
0.250
16.119
0.000
S = 1.452
R = 64.66%
= 64.41%
Radi
a) Write out the linear model.
y- -0.357
b) Interpret the intercept.
4.034
poverty %
Expected heart weight of cats with no body weight is 4.034 kg
Expected body weight of cats with no heart weight is 4.034 g
For each additional 1 g increase in heart weight, we expect body weight to
decrease by 0.357 kg
For each additional 1 g increase in heart weight, we expect body weight to
increase by 0.357 kg
For each additional 1 g increase in heart weight, we expect body weight to
increase by 4.034 kg
Expected heart weight of cats with no body weight is -0.357 kg
Expected body weight of cats with no heart weight is -0.357 g
For each additional 1 kg increase in body weight, we expect heart weight to
decrease by 0.357 g
For each additional 1 kg increase in body weight, we expect heart weight to
increase bu 4034 a
Heart weight (g)](/v2/_next/image?url=https%3A%2F%2Fcontent.bartleby.com%2Fqna-images%2Fquestion%2Fb6fcc9de-2c12-46f2-94d4-6703c9087dda%2F298a51bf-7090-4919-885d-aab1e6342916%2Fvmglje_processed.png&w=3840&q=75)
Transcribed Image Text:The following regression output is for predicting the heart weight (in g) of cats from
their body weight (in kg). The coecients are estimated using a dataset of 144
domestic cats.
20-
15-
5-
2.0
2.5
3.0
3.5
4.0
Body weight (kg)
Std. Error
Pr(>[t])
0.607
Estimate
t value
(Intercept)
body wt
-0.357
0.692
-0.515
4.034
0.250
16.119
0.000
S = 1.452
R = 64.66%
= 64.41%
Radi
a) Write out the linear model.
y- -0.357
b) Interpret the intercept.
4.034
poverty %
Expected heart weight of cats with no body weight is 4.034 kg
Expected body weight of cats with no heart weight is 4.034 g
For each additional 1 g increase in heart weight, we expect body weight to
decrease by 0.357 kg
For each additional 1 g increase in heart weight, we expect body weight to
increase by 0.357 kg
For each additional 1 g increase in heart weight, we expect body weight to
increase by 4.034 kg
Expected heart weight of cats with no body weight is -0.357 kg
Expected body weight of cats with no heart weight is -0.357 g
For each additional 1 kg increase in body weight, we expect heart weight to
decrease by 0.357 g
For each additional 1 kg increase in body weight, we expect heart weight to
increase bu 4034 a
Heart weight (g)
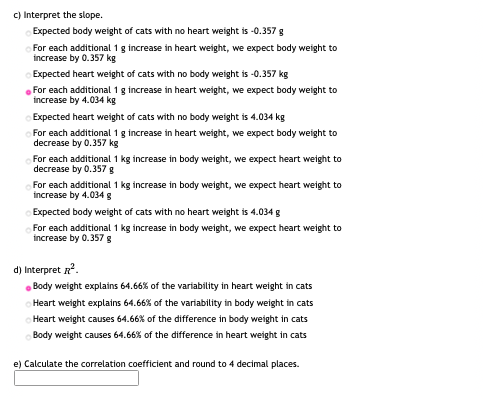
Transcribed Image Text:C) Interpret the slope.
Expected body weight of cats with no heart weight is -0.357 g
For each additional 1 g increase in heart weight, we expect body weight to
increase by 0.357 kg
Expected heart weight of cats with no body weight is -0.357 kg
For each additional 1 g increase in heart weight, we expect body weight to
increase by 4.034 kg
Expected heart weight of cats with no body weight is 4.034 kg
For each additional 1 g increase in heart weight, we expect body weight to
decrease by 0.357 kg
For each additional 1 kg increase in body weight, we expect heart weight to
decrease by 0.357 g
For each additional 1 kg increase in body weight, we expect heart weight to
increase by 4.034 g
Expected body weight of cats with no heart weight is 4.034 g
For each additional 1 kg increase in body weight, we expect heart weight to
increase by 0.357g
d) Interpret .
. Body weight explains 64.66% of the variability in heart weight in cats
Heart weight explains 64.66% of the variability in body weight in cats
Heart weight causes 64.66% of the difference in body weight in cats
Body weight causes 64.66% of the difference in heart weight in cats
e) Calculate the correlation coefficient and round to 4 decimal places.
Expert Solution
This question has been solved!
Explore an expertly crafted, step-by-step solution for a thorough understanding of key concepts.

This is a popular solution!

Trending now
This is a popular solution!

Step by step
Solved in 6 steps with 1 images

Recommended textbooks for you
College Algebra
Algebra
ISBN:
9781305115545
Author:
James Stewart, Lothar Redlin, Saleem Watson
Publisher:
Cengage Learning

Algebra & Trigonometry with Analytic Geometry
Algebra
ISBN:
9781133382119
Author:
Swokowski
Publisher:
Cengage

Algebra and Trigonometry (MindTap Course List)
Algebra
ISBN:
9781305071742
Author:
James Stewart, Lothar Redlin, Saleem Watson
Publisher:
Cengage Learning
College Algebra
Algebra
ISBN:
9781305115545
Author:
James Stewart, Lothar Redlin, Saleem Watson
Publisher:
Cengage Learning
Algebra & Trigonometry with Analytic Geometry
Algebra
ISBN:
9781133382119
Author:
Swokowski
Publisher:
Cengage
Algebra and Trigonometry (MindTap Course List)
Algebra
ISBN:
9781305071742
Author:
James Stewart, Lothar Redlin, Saleem Watson
Publisher:
Cengage Learning

Functions and Change: A Modeling Approach to Coll…
Algebra
ISBN:
9781337111348
Author:
Bruce Crauder, Benny Evans, Alan Noell
Publisher:
Cengage Learning