The following sample data represent the number of late and on time flights for the Delta, United and US Airways. Excel File: data12-19.xlsx Airline Flight US Airways Delta United Late 39 51 56 On Time 261 249 344 a. Formulate the hypotheses for a test that will determine whether the population proportion of late flights is the same for all three airlines. Ho : All population proportions are equal Ha : Not all population proportions are equal b. Conduct the hypothesis test with a 0.05 level of significance. What is the p-value? Use Table 3 of Appendix B. The p-value is greater than 0.10 What is your conclusion? Unable to reject the null hypothesis that the population proportions are same c. Compute the sample proportion of late flights for each airline. (to 2 decimals) P2 (to 2 decimals) (to 2 decimals) What is the overall proportion of late flights for the three airlines? Round your answer to three decimal places. The overall proportion of late flights for the three airlines is
The following sample data represent the number of late and on time flights for the Delta, United and US Airways. Excel File: data12-19.xlsx Airline Flight US Airways Delta United Late 39 51 56 On Time 261 249 344 a. Formulate the hypotheses for a test that will determine whether the population proportion of late flights is the same for all three airlines. Ho : All population proportions are equal Ha : Not all population proportions are equal b. Conduct the hypothesis test with a 0.05 level of significance. What is the p-value? Use Table 3 of Appendix B. The p-value is greater than 0.10 What is your conclusion? Unable to reject the null hypothesis that the population proportions are same c. Compute the sample proportion of late flights for each airline. (to 2 decimals) P2 (to 2 decimals) (to 2 decimals) What is the overall proportion of late flights for the three airlines? Round your answer to three decimal places. The overall proportion of late flights for the three airlines is

College Algebra (MindTap Course List)
12th Edition
ISBN:9781305652231
Author:R. David Gustafson, Jeff Hughes
Publisher:R. David Gustafson, Jeff Hughes
Chapter8: Sequences, Series, And Probability
Section8.7: Probability
Problem 5E: List the sample space of each experiment. Rolling one die and tossing one coin

Related questions
Question
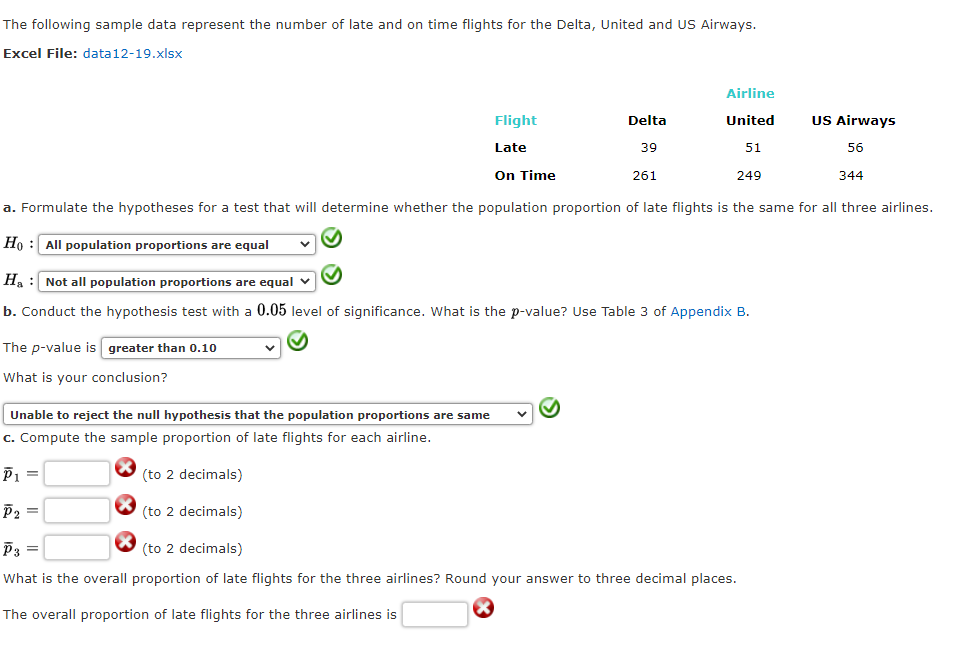
Transcribed Image Text:The following sample data represent the number of late and on time flights for the Delta, United and US Airways.
Excel File: data12-19.xlsx
Airline
Flight
US Airways
Delta
United
Late
39
51
56
On Time
261
249
344
a. Formulate the hypotheses for a test that will determine whether the population proportion of late flights is the same for all three airlines.
Ho : All population proportions are equal
Ha : Not all population proportions are equal
b. Conduct the hypothesis test with a 0.05 level of significance. What is the p-value? Use Table 3 of Appendix B.
The p-value is greater than 0.10
What is your conclusion?
Unable to reject the null hypothesis that the population proportions are same
c. Compute the sample proportion of late flights for each airline.
(to 2 decimals)
P2
(to 2 decimals)
(to 2 decimals)
What is the overall proportion of late flights for the three airlines? Round your answer to three decimal places.
The overall proportion of late flights for the three airlines is
Expert Solution
This question has been solved!
Explore an expertly crafted, step-by-step solution for a thorough understanding of key concepts.

This is a popular solution!

Trending now
This is a popular solution!

Step by step
Solved in 2 steps with 1 images

Recommended textbooks for you
College Algebra (MindTap Course List)
Algebra
ISBN:
9781305652231
Author:
R. David Gustafson, Jeff Hughes
Publisher:
Cengage Learning
College Algebra (MindTap Course List)
Algebra
ISBN:
9781305652231
Author:
R. David Gustafson, Jeff Hughes
Publisher:
Cengage Learning