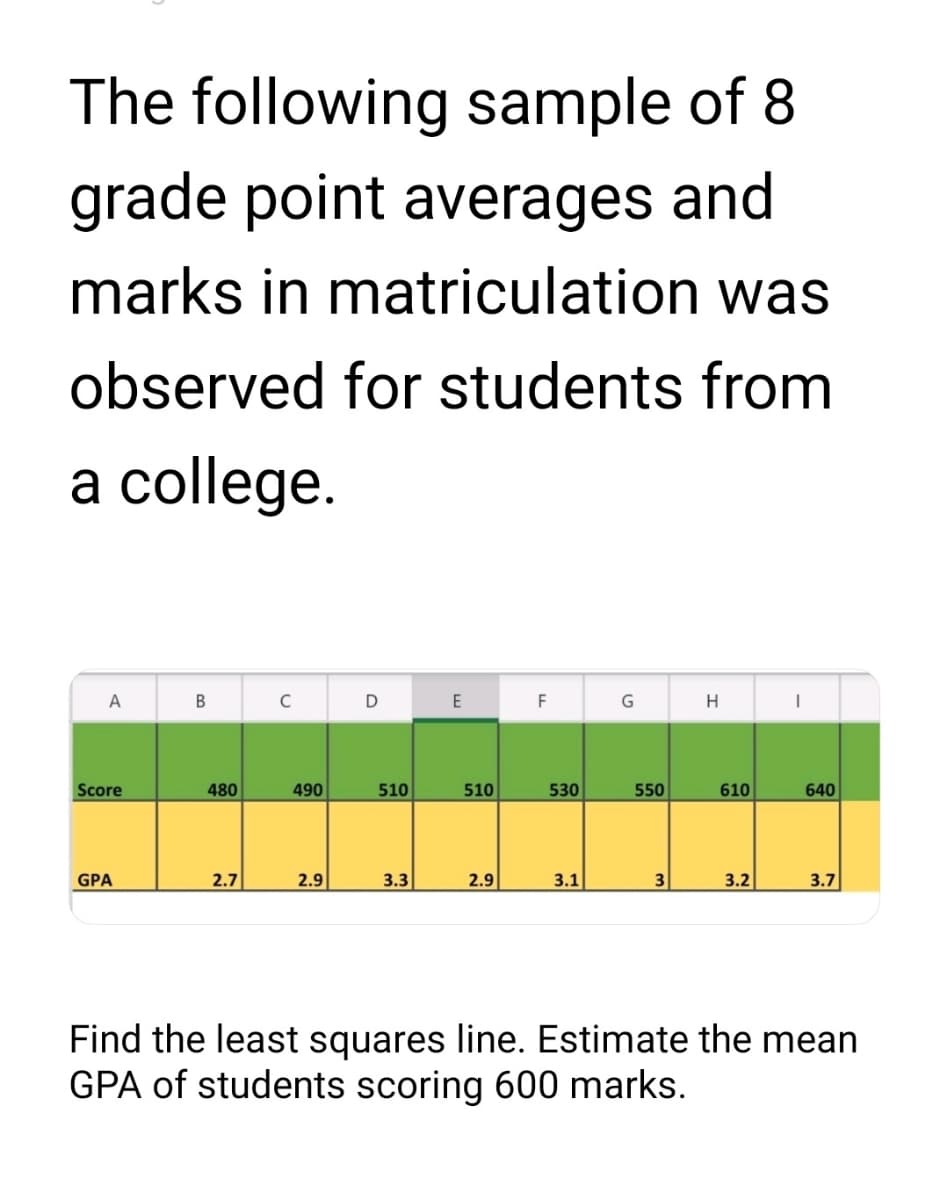
The following sample of 8 grade point averages and marks in matriculation was observed for students from a college. A Score GPA 480 2.7 490 2.9 D 510 3.3 E 510 2.9 F 530 3.1 550 3 H 610 3.2 640 3.7 Find the least squares line. Estimate the mean GPA of students scoring 600 marks.


Q: The thickness (in millimeters) of the coating applied to hard drives is one characteristic that…
A: Sampling distribution describe the sample probability follows an method. It is based on the sample…
Q: A student was asked to find a 99% confidence interval for the proportion of students who take notes…
A: Given that n = 75 99 % confidence interval is 0.15 < p < 0.2
Q: Since an instant replay system for tennis was introduced at a major tournament, men challenged 1441…
A: Solution-: Given: n1=1441,n2=747,x1=429,x2=215,α=0.01 We want to find, (a) What is null and…
Q: Find p value (a) upper-tailed test, df = 7, t = 2.00 (b) upper-tailed test, n = 14, t = 3.50…
A: Given (a) upper-tailed test, df = 7 t = 2.00 (b) upper-tailed test, n = 14, t = 3.50…
Q: A nutritionist wants to investigate whether her new diet will be effective in helping women aged…
A:
Q: Based upon the output provided, what is sample size?
A: Given information : Correlation Matrix for the variables Travel and Satisfaction is given.
Q: The time that a randomly selected individual waits for an elevator in an office building has a…
A: Population is the whole set of observation used for the study. Sample is the subset of the…
Q: A polling organization reported data from a survey of 2000 randomly selected Canadians who carry…
A: From the provided information, Sample size (n) = 200 Sample mean (x̄) = 9.13 Standard deviation (s)…
Q: What is the z-score of x = 9, if it is 0.133 standard deviations to the left of the mean?
A: Given X=9,
Q: QUESTION 9 Manufacturer claims that the average length of time the new smartphone battery holds…
A: Given that Population mean μ =9
Q: Researchers conducted a study to determine whether magnets are effective in treating back pain. Pain…
A:
Q: 1) Let X₁, X2, X3, ... Xn be a sequence of independent and identically distributed with the…
A: Given pdf f(x;θ)=1/√(2π)e^(-1/2(x-θ)2) Note: According to Bartleby guidelines expert solve only…
Q: The mayor is interested in finding a 90% confidence interval for the mean number of pounds of trash…
A:
Q: A long-distance phone company wishes to estimate the mean duration of long-distance calls…
A: Data given n=15 Data: 5,5,2,5,5,17,21,29,31,13,1,19,12,2,37
Q: Hypothesis Test: Perform the specified hypothesis test. Be sure to include your statistical and…
A: Given that Population proportion (p)= 0.52 Sample size (n)= 1000 A recent survey found that 512 of…
Q: A new assembly-line procedure to increase production has been suggested by Mr. Mump. To test whether…
A:
Q: Consider the following sample with 20 observations: 1 1 5 7 9 11 11 14 14 19 20 21 23…
A: Note: Hi, thank you for the question. As per our company guideline we are supposed to answer only…
Q: A random sample selected from a normal population with mean variance o2 gave the values 25, 31, 23,…
A:
Q: The amount of time a certain brand of light bulb lasts is normally distributed with a mean of 1300…
A: A continuous random variable X is said to follow Normal distribution with parameters μ and σ2 if its…
Q: Determine the cumulative deviations and the backlog for each period.
A: we use excel to solve this problem
Q: The chi-square statistic. Multiple Choice O is greater than or equal to zero O is less than or equal…
A: It is given that the chi-square statistic.
Q: For the data and sample regression equation shown below, 4 602 68-2-4 y = -4+2x X y a. Determine the…
A: Given: Let us consider the given sample x and y x y 4 6 6 8 0 -2 2 -4 The Given sample…
Q: Question 5 Question Help: Suppose that textbook weights are normally distributed. You measure 30…
A: Given that Sample size n =30 Sample mean =38 Population standard deviation =8.6
Q: Question 2 Licensed Nuclear Reactors The data show the number of licensed nuclear reactors in…
A:
Q: Calculate the 80th percentile of the data shown x 1.4 1.9 2 2.3 3 9.2 9.7 10.8 14.9 16.8 17.1 17.4…
A: It is needed to obtain the 80th percentile.
Q: The Ball Corporation's beverage can manufacturing plant in Fort Atkinson, Wisconsin, uses a metal…
A: Given that n = 60 , x̄ = 0.2320 , σ = 0.000507
Q: For a data set of brain volumes (cm3) and IQ scores of eleven males, the linear correlation…
A: The linear correlation coefficient for the brin volumes and IQ scores of eleven males is 0.883.
Q: In the past, the mean running time for a certain type of flashlight battery has been 8.6 hours. The…
A:
Q: The number X of insect larvæfound on a cm² on a petri plate is assumed to follow a Poisson…
A:
Q: a. For this study, we should use Select an answer b. The null and alternative hypotheses would be:…
A: Given that n = 393 , X = 94 , p = 20% = 0.20 Note: According to bartleby experts question answers…
Q: What is a semi-structural interview?
A: Note: As per the guidelines, we are allowed to answer first question when multiple questions are…
Q: Two machines, X and Y, produce earbuds. Let X represent the diameter of an earbud produced by…
A: Mean is the average of all the observations. It is calculated by dividing the number of observations…
Q: For a data set of chest sizes (distance around chest in inches) and weights (pounds) of ten…
A: The sample size n is 10.
Q: You wish to test the following claim (HaHa) at a significance level of α=0.10α=0.10.…
A: The random variable X follows normal distribution. We have to test whether the population mean is…
Q: A study was conducted to determine the proportion of people who dream in black and white instead of…
A: Let p1 be the proportion of people over 55 who dream in black and white and p2 be the proportion of…
Q: Show that 2"=nCk and 0 = [(-1)^nck k=0 HINT: Consider(1-1)" and (1+1)" k=0
A:
Q: Suppose that a particular candidate for public office is in fact favored by 48% of all registered…
A:
Q: When Rajani goes bowling, her scores are normally distributed with a mean of 125 and a standard…
A:
Q: If y, , have a joint density (9,41,42,43) = (++), 0≤9.4.1 0 elsewhere evaluate the regression of g…
A:
Q: the solution provided is incorrect. please provide correct solution
A: Given that Sample size=700 Population proportion=0.20 Level of significance=0.01 We have to Test the…
Q: The distribution of heights of adult men is approximately normal with mean 69 inches and standard…
A: “Since you have posted a question with multiple sub-parts, we will solve first three sub-parts for…
Q: y cries for 4 times after midnight is 4/50. The probability that a newborn baby cries for 5 times…
A: Given: Number of times (x) P (X=x) 0 2/50 1 11/50 2 23/50 3 9/50 4 4/50 5 1/50
Q: our brands of flashlight batteries are to be compared by testing each brand in five flashlights.…
A: Given : number of categories (k)=4 number of observation (n)=20
Q: Determine whether the outcome is a Type I error, a Type II error, or a correct decision. A test is…
A: Given H0: μ = 45 vs H1: μ< 45 Ho is not rejected
Q: QUESTION 8 Researchers used the least-squares method to study the relationship between the length of…
A: Let Y be the number of product purchased X be the the length time of a commercial
Q: For a confidence level of 92%, find the critical value Question Help: Video Message instructor…
A: The value of the test statistic that establishes the upper and lower bounds of a confidence interval…
Q: B - Does there appear to be a relationship between income and sadness, hopelessness, and…
A: From the above plot, we can see that when the income is low then the sadness, hopelessness and…
Q: The average rate per hour of an employee in a fastfood chain is Php 38 with a standard deviation of…
A: Given Population mean μ=38, standard deviations σ=5 Let X be the rate per hour of an employee in a…
Q: Acrylic bone cement is sometimes used in hip and knee replacements to fix an artificial joint in…
A: Given that mean =306.17,s.d =41.96 ,n =8 ,alpha=0.05 Find 95% confidence interval.

Step by step
Solved in 4 steps with 4 images

- The following table shows the assessed values and the selling prices of eight houses, constituting a random sam-ple of all the houses sold recently in a metropolitan area: Assessed value Selling price(thousands) (thousands)(of dollars) (of dollars)170.3 214.4202.0 269.3162.5 206.2174.8 225.0157.9 199.8181.6 232.1210.4 274.2188.0 243.5 (a) Fit a least squares line that will enable us to predictthe selling price of a house in that metropolitan area interms of its assessed value. (b) Test the null hypothesis β = 1.30 against the alterna-tive hypothesis β > 1.30 at the 0.05 level of significance.Suppose a doctor measures the height, x, and head circumference, y, of 11 children and obtains the data below. The correlation coefficient is 0.904 and the least squares regression line is y=0.208x+11.736. Complete parts (a) and (b) below.A scrap metal dealer claims that the mean of his cash sales is 'no more that R80', but an Internal Revenue Service agent believes the dealer is untruthful. The agent randomly selects a sample of 20 cash customers and find the mean purchase to be R91, with a variance of R441. What is the critical value?
- A survey of the population of 51 students in Psych 311 asks how many credits students are taking and obtains the following normally-distributed results: ∑ X= 686 and ∑X2= 9832.92. Using this information, answer the following three questions. What is the percentile rank of a student who is enrolled in 15 credits? (Hint: This is the same thing as asking “what percentage of students is enrolled in 15 credits or less?”) MUST SHOW WORK FOR THIS PROBLEM What percentage of students are enrolled in between 12 and 18 credits? (MUST SHOW WORK FOR THIS PROBLEM) What is the 25th percentile? (Hint: This is the same as asking what score separates the bottom 25% of the distribution from the top 75%.) MUST SHOW WORK FOR THIS PROBLEMA simple random sample of heights of 6400Englishmen has a mean of 67.85 inches and SD 2.56 inches, while a simple random sample of heights of 1600 Australians has a mean of 68.55 inches and SD of 2.52 inches. D the data indicate that Australians are, on the average, taller than Englishmen?Is a baseball players' slugging percentage correlated to their strikeout percentage? A random sample of n=6n=6professional baseball players gave the following data (Source: baseball-reference.com) Slugging 0.396 0.42 0.323 0.078 0.473 0.467 Strikeouts 27 14.3 30.8 47.1 17.8 36.7 Find the least squares line if we consider slugging percengtage as the explanatory variable and strikeout percentage as the response variable. (Round the y-intercept and slope to 2 decimal places.)y^ = For a unit increase in slugging percentage, how much of a decrease Correct in strikeout percentage is predicted? (Round your answer to 2 decimal places.) What percentage of the variation in strikeout percentage (yy) can be explained by slugging percentage (xx) and the least squares line? (Round to the nearest percent.) p-value (Round to four decimal places)
- A one-way analysis of variances produces dftotal = 39 and dfwithin = 36. For this analysis, what is dfbetween? A)1 B) 2 C) 3 D) 0The r2represents the shared variance between a predictor and _______Suppose that a study is conducted to determine if environmental aspects and feed type impact the growth of chickens, specifically their weight over time. An ANOVA procedure is conducted and the following table results: Sourcefeed typeenvironmentResiduals Sum of Squares23112924195532 DF5164 Mean Squares46226243055 F-statistic15.130.0079 To determine if there a significant effect on a chicks weight due to their environment, an F-test on the variable “environment” is conducted. How many levels of "environment" are there? Report the correct F-statistic. Do not round! How many numerator degrees of freedom does the F-statistic have? How many denominator degrees of freedom does the F-statistic have?
- Suppose that a study is conducted to determine if environmental aspects and feed type impact the growth of chickens, specifically their weight over time. An ANOVA procedure is conducted and the following table results: Sourcefeed typeenvironmentResiduals Sum of Squares23112924195532 DF5164 Mean Squares46226243055 F-statistic15.130.0079 To determine if there a significant effect on a chicks weight due to their environment, an F-test on the variable “environment” is conducted. Is the main effect of “environment” significant at the 0.05 significance level? Yes, since the F-statistic is less than 0.05 Yes, since the p-value associated with the F-statistic for "environment" is less than 0.05. No, since the p-value associated with the F-statistic for "environment" is greater than 0.05.A simple random sample of heights of 6400 Englishmen has a mean of67.85 inches and SD 2.56 inches, while a simple random sample of heightsof 1600 Australians has a mean of 68.55 inches and SD of 2.52 inches. Dothe data indicate that Australians are, on the average, taller thanEnglishmen?Which of the following not used in an F-ratio for the two-factor analysis of variance? MSA MSAxB MSbetween treatments MSwithin treatments
