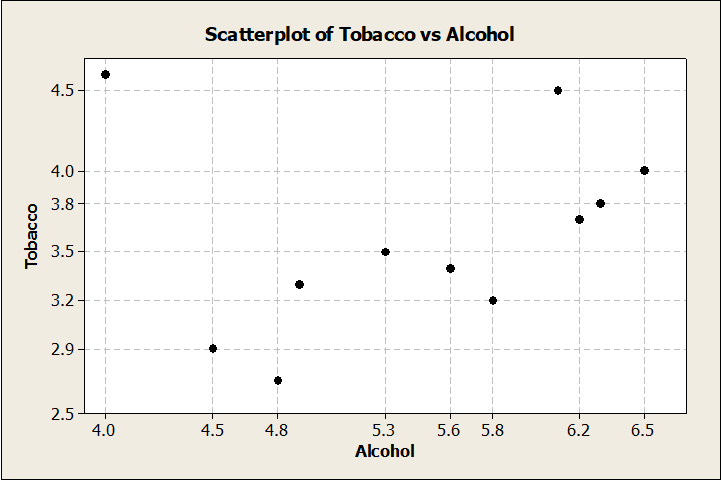
The following scatterplot graphically displays the average weekly spending on tobacco products and alcoholic beverages for each of 11 regions in Britain. 1. The point representing Northern Ireland is an outlier. What is the alcohol spending in Northern Ireland? AC 4, 3.6, 4.6 2.5 ["", "", "", ""] 2. The correlation with all 11 regions is 0.224. Which one is the most plausible value for the correlation of the 10 remaining regions with Northern Ireland (the outlier) removed (no calculation necessary)? AC -.05, .01, 1.09, .78 ["", "", "", ""] 3. Which one of the following values is the best choice for the range of tobacco spending across all 11 counties? AC 4.6, 4.0, 2.6, 2.0 ["", "", "", ""] 4. Which one of the following values is the best choice for the IQR of the alcohol spending across all 11 counties? AC .81, 1.39, .25 2.17 ["", "", "", ""] 5. Which one of the following values is the best choice for the median alcohol spending across all 11 counties? AC 5.6, 4.7 3.2, 3.7


Inverse Normal Distribution
The method used for finding the corresponding z-critical value in a normal distribution using the known probability is said to be an inverse normal distribution. The inverse normal distribution is a continuous probability distribution with a family of two parameters.
Mean, Median, Mode
It is a descriptive summary of a data set. It can be defined by using some of the measures. The central tendencies do not provide information regarding individual data from the dataset. However, they give a summary of the data set. The central tendency or measure of central tendency is a central or typical value for a probability distribution.
Z-Scores
A z-score is a unit of measurement used in statistics to describe the position of a raw score in terms of its distance from the mean, measured with reference to standard deviation from the mean. Z-scores are useful in statistics because they allow comparison between two scores that belong to different normal distributions.
The following
1. The point representing Northern Ireland is an outlier. What is the alcohol spending in Northern Ireland? AC 4, 3.6, 4.6 2.5 ["", "", "", ""]
2. The
3. Which one of the following values is the best choice for the
4. Which one of the following values is the best choice for the IQR of the alcohol spending across all 11 counties? AC .81, 1.39, .25 2.17 ["", "", "", ""]
5. Which one of the following values is the best choice for the median alcohol spending across all 11 counties? AC 5.6, 4.7 3.2, 3.7


Trending now
This is a popular solution!

Step by step
Solved in 7 steps


