Spot Speed (kph) 50.7 36.6 59.1 56.6 57.3 70.4 44.4 42.9 67.9 67.3 70.6 67.4 66.6 57.5 48 56 46.2 48.2 74.1 65.4 50.4 67.3 55.9 69.3 71.1 68.1 50.6 47.1 76.6 65 37.2 67 38.7 44.8 61 32.8 65.4 53.8 53.9 34.7 45.9 65.7 74.1 59.4 44.8 55.6 65.2 49 54.8 67 65.4 44.2 66.1 63.7 65.5 67.1 62.7 53.9 39.4 63.8 51.7 65.4 60.8 53.4
Spot Speed (kph) 50.7 36.6 59.1 56.6 57.3 70.4 44.4 42.9 67.9 67.3 70.6 67.4 66.6 57.5 48 56 46.2 48.2 74.1 65.4 50.4 67.3 55.9 69.3 71.1 68.1 50.6 47.1 76.6 65 37.2 67 38.7 44.8 61 32.8 65.4 53.8 53.9 34.7 45.9 65.7 74.1 59.4 44.8 55.6 65.2 49 54.8 67 65.4 44.2 66.1 63.7 65.5 67.1 62.7 53.9 39.4 63.8 51.7 65.4 60.8 53.4

Mathematics For Machine Technology
8th Edition
ISBN:9781337798310
Author:Peterson, John.
Publisher:Peterson, John.
Chapter29: Tolerance, Clearance, And Interference
Section: Chapter Questions
Problem 16A: Spacers are manufactured to the mean dimension and tolerance shown in Figure 29-12. An inspector...

Related questions
Question
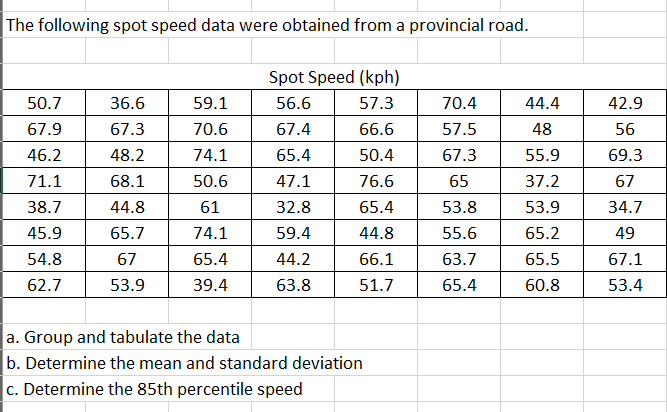
Transcribed Image Text:The following spot speed data were obtained from a provincial road.
Spot Speed (kph)
50.7
36.6
59.1
56.6
57.3
70.4
44.4
42.9
67.9
67.3
70.6
67.4
66.6
57.5
48
56
46.2
48.2
74.1
65.4
50.4
67.3
55.9
69.3
71.1
68.1
50.6
47.1
76.6
65
37.2
67
38.7
44.8
61
32.8
65.4
53.8
53.9
34.7
45.9
65.7
74.1
59.4
44.8
55.6
65.2
49
54.8
67
65.4
44.2
66.1
63.7
65.5
67.1
62.7
53.9
39.4
63.8
51.7
65.4
60.8
53.4
|a. Group and tabulate the data
b. Determine the mean and standard deviation
|c. Determine the 85th percentile speed
Expert Solution
This question has been solved!
Explore an expertly crafted, step-by-step solution for a thorough understanding of key concepts.

Step by step
Solved in 3 steps

Recommended textbooks for you
Mathematics For Machine Technology
Advanced Math
ISBN:
9781337798310
Author:
Peterson, John.
Publisher:
Cengage Learning,
Mathematics For Machine Technology
Advanced Math
ISBN:
9781337798310
Author:
Peterson, John.
Publisher:
Cengage Learning,