The following table contains the ACT scores' (i.e. standardized test scores for high school achievement and university admissions in the United States) and the GPA (grade point average) for eight university students. Grade point average is based on a four- point scale and has been rounded to one digit after the decimal.
The following table contains the ACT scores' (i.e. standardized test scores for high school achievement and university admissions in the United States) and the GPA (grade point average) for eight university students. Grade point average is based on a four- point scale and has been rounded to one digit after the decimal.

Glencoe Algebra 1, Student Edition, 9780079039897, 0079039898, 2018
18th Edition
ISBN:9780079039897
Author:Carter
Publisher:Carter
Chapter10: Statistics
Section10.1: Measures Of Center
Problem 14PPS

Related questions
Question
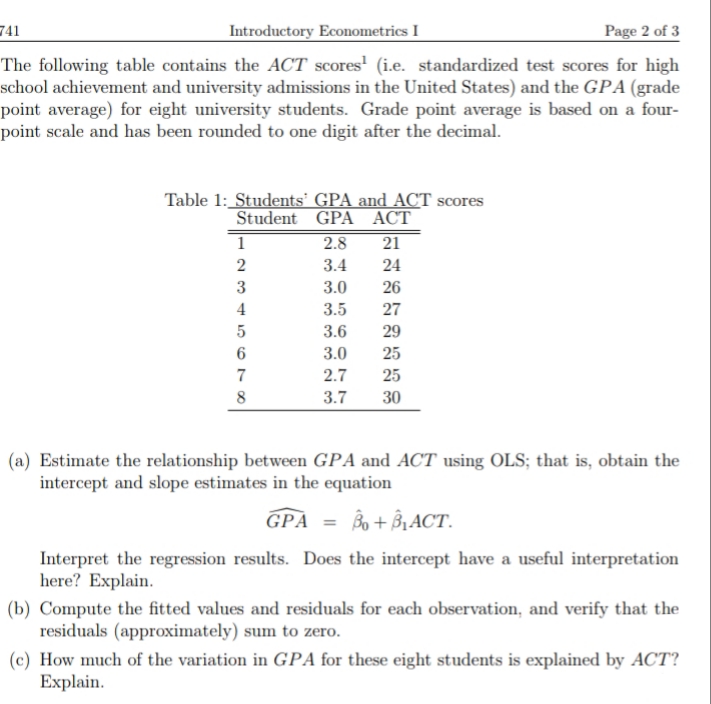
Transcribed Image Text:741
Introductory Econometrics I
Page 2 of 3
The following table contains the ACT scores' (i.e. standardized test scores for high
school achievement and university admissions in the United States) and the GPA (grade
point average) for eight university students. Grade point average is based on a four-
point scale and has been rounded to one digit after the decimal.
Table 1: Students' GPA and ACT scores
Student GPA ACT
1
2.8
21
2
3.4
24
3
3.0
26
27
29
4
3.5
5
3.6
3.0
2.7
25
7
25
8
3.7
30
(a) Estimate the relationship between GPA and ACT using OLS; that is, obtain the
intercept and slope estimates in the equation
GPA
Bo + B, ACT.
Interpret the regression results. Does the intercept have a useful interpretation
here? Explain.
(b) Compute the fitted values and residuals for each observation, and verify that the
residuals (approximately) sum to zero.
(c) How much of the variation in GPA for these eight students is explained by ACT?
Explain.
Expert Solution
This question has been solved!
Explore an expertly crafted, step-by-step solution for a thorough understanding of key concepts.

This is a popular solution!

Trending now
This is a popular solution!

Step by step
Solved in 3 steps with 2 images

Knowledge Booster


Learn more about
Need a deep-dive on the concept behind this application? Look no further. Learn more about this topic, statistics and related others by exploring similar questions and additional content below.Recommended textbooks for you
Glencoe Algebra 1, Student Edition, 9780079039897…
Algebra
ISBN:
9780079039897
Author:
Carter
Publisher:
McGraw Hill
Glencoe Algebra 1, Student Edition, 9780079039897…
Algebra
ISBN:
9780079039897
Author:
Carter
Publisher:
McGraw Hill