The following table contains the number of successes and failures for three categories of a variable. Test whether the proportions are equal for each category at the a = 0.1 level of significance. Category 1 Category 2 Category 3 72 Failures 48 82 Successes 36 30 29 O B. Ho: The categories of the variable and success and failure are dependent. H: The categories of the variable and success and failure are independent. O C. Ho H1 = E, and µ2 = E, and µ3 = E3 H: At least one mean is different from what is expected. O D. Ho: The categories of the variable and success and failure are independent. H: The categories of the variable and success and failure are dependent. What is the P-value? (Round to three decimal places as needed.) click Check Answer
The following table contains the number of successes and failures for three categories of a variable. Test whether the proportions are equal for each category at the a = 0.1 level of significance. Category 1 Category 2 Category 3 72 Failures 48 82 Successes 36 30 29 O B. Ho: The categories of the variable and success and failure are dependent. H: The categories of the variable and success and failure are independent. O C. Ho H1 = E, and µ2 = E, and µ3 = E3 H: At least one mean is different from what is expected. O D. Ho: The categories of the variable and success and failure are independent. H: The categories of the variable and success and failure are dependent. What is the P-value? (Round to three decimal places as needed.) click Check Answer

Glencoe Algebra 1, Student Edition, 9780079039897, 0079039898, 2018
18th Edition
ISBN:9780079039897
Author:Carter
Publisher:Carter
Chapter10: Statistics
Section10.6: Summarizing Categorical Data
Problem 27PPS

Related questions
Topic Video
Question
100%
3/10
what is the P value? Round to three decimal places as needed.
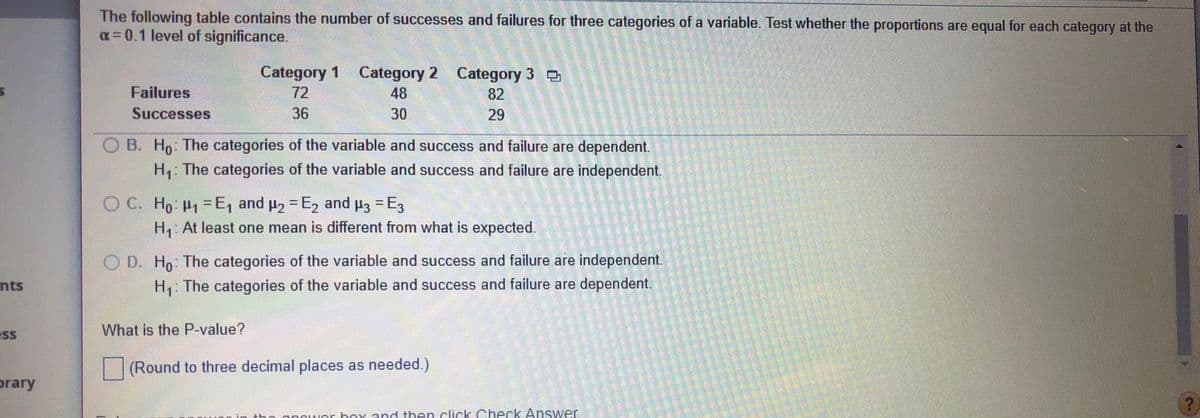
Transcribed Image Text:The following table contains the number of successes and failures for three categories of a variable. Test whether the proportions are equal for each category at the
a=0.1 level of significance.
Category 1 Category 2 Category 3 o
Failures
72
48
82
Successes
36
30
29
B. Ho The categories of the variable and success and failure are dependent.
The categories of the variable and success and failure are independent.
OC. Ho P-E, and p2- E, and p3 -E3
H2 = E, and
H3 = E3
%3D
H At least one mean is different from what is expected.
O D. H,: The categories of the variable and success and failure are independent.
nts
H,: The categories of the variable and success and failure are dependent.
What is the P-value?
SS
(Round to three decimal places as needed.)
prary
anrwor hoy and then.click Check Answer
%3D
Expert Solution
This question has been solved!
Explore an expertly crafted, step-by-step solution for a thorough understanding of key concepts.

Step by step
Solved in 3 steps with 3 images

Knowledge Booster


Learn more about
Need a deep-dive on the concept behind this application? Look no further. Learn more about this topic, statistics and related others by exploring similar questions and additional content below.Recommended textbooks for you
Glencoe Algebra 1, Student Edition, 9780079039897…
Algebra
ISBN:
9780079039897
Author:
Carter
Publisher:
McGraw Hill

Big Ideas Math A Bridge To Success Algebra 1: Stu…
Algebra
ISBN:
9781680331141
Author:
HOUGHTON MIFFLIN HARCOURT
Publisher:
Houghton Mifflin Harcourt
Glencoe Algebra 1, Student Edition, 9780079039897…
Algebra
ISBN:
9780079039897
Author:
Carter
Publisher:
McGraw Hill
Big Ideas Math A Bridge To Success Algebra 1: Stu…
Algebra
ISBN:
9781680331141
Author:
HOUGHTON MIFFLIN HARCOURT
Publisher:
Houghton Mifflin Harcourt