The following table contains the number of successes and failures for three categories of a variable. Test whether the proportions are equal for each category at the a = 0.01 level of significance. Category 1 Category 2 Category 3 O Failures 58 70 33 Successes 59 46 72 E Click the icon to view the Chi-Square table of critical values. State the hypotheses. Choose the correct answer below. A. Ho: P1 = P2 = P3 H1: At least one of the proportions is different from the others. B. Ho: The categories of the variable and success and failure are independent. H,: The categories of the variable and success and failure are dependent. C. Ho: The categories of the variable and success and failure are dependent. H1: The categories of the variable and success and failure are independent. D. Ho: H1 = E, and µ2 = E2 and H3 = E3 H1: At least one mean is different from what is expected. Compute the value of the chi-square test statistic. Xổ =(Round to three decimal places as needed.)
The following table contains the number of successes and failures for three categories of a variable. Test whether the proportions are equal for each category at the a = 0.01 level of significance. Category 1 Category 2 Category 3 O Failures 58 70 33 Successes 59 46 72 E Click the icon to view the Chi-Square table of critical values. State the hypotheses. Choose the correct answer below. A. Ho: P1 = P2 = P3 H1: At least one of the proportions is different from the others. B. Ho: The categories of the variable and success and failure are independent. H,: The categories of the variable and success and failure are dependent. C. Ho: The categories of the variable and success and failure are dependent. H1: The categories of the variable and success and failure are independent. D. Ho: H1 = E, and µ2 = E2 and H3 = E3 H1: At least one mean is different from what is expected. Compute the value of the chi-square test statistic. Xổ =(Round to three decimal places as needed.)

Glencoe Algebra 1, Student Edition, 9780079039897, 0079039898, 2018
18th Edition
ISBN:9780079039897
Author:Carter
Publisher:Carter
Chapter10: Statistics
Section10.3: Measures Of Spread
Problem 1GP

Related questions
Question
HW11Q9
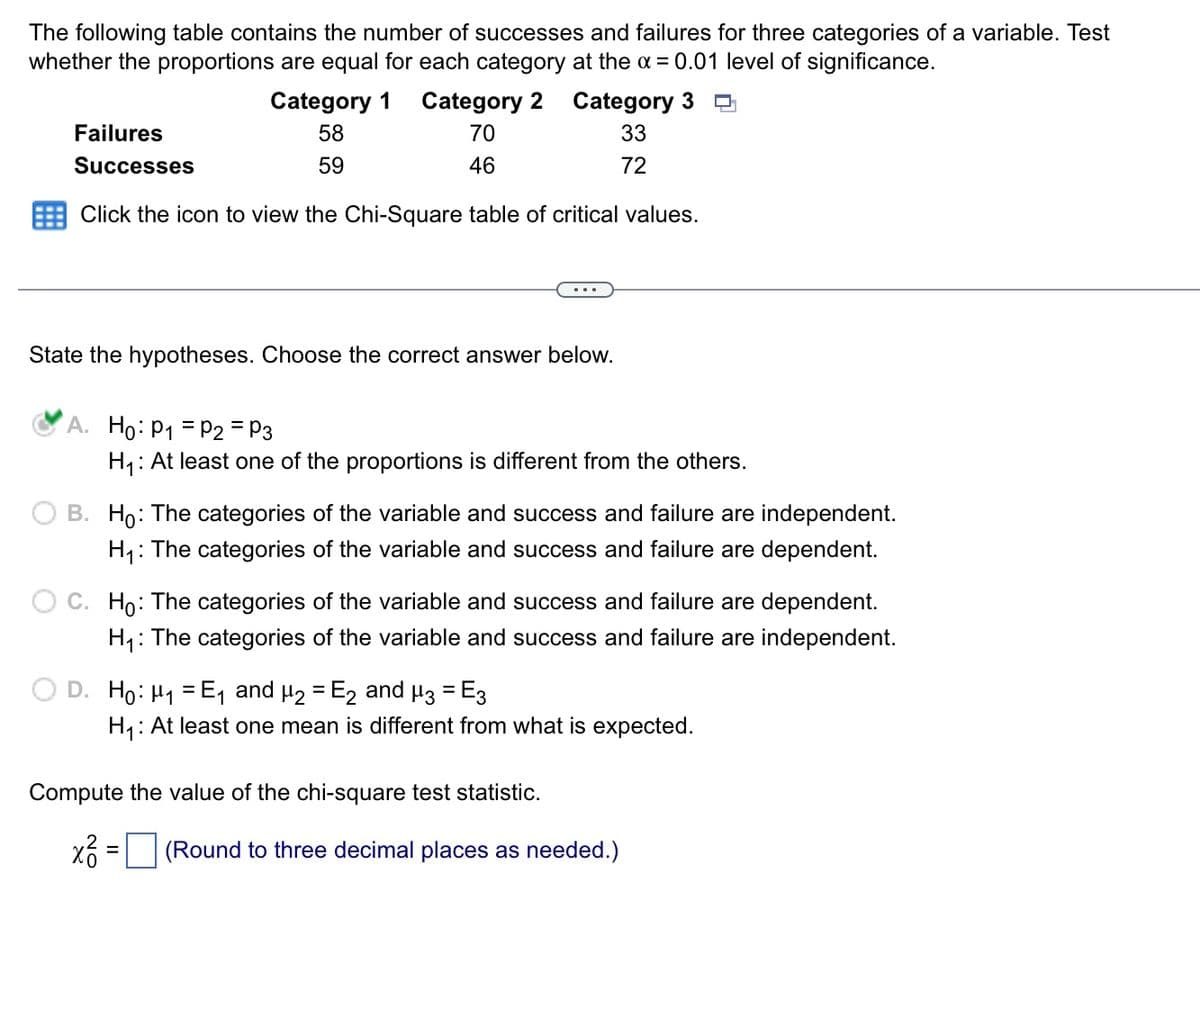
Transcribed Image Text:The following table contains the number of successes and failures for three categories of a variable. Test
whether the proportions are equal for each category at the a = 0.01 level of significance.
Category 1
Category 2
Category 3
Failures
58
70
33
Successes
59
46
72
Click the icon to view the Chi-Square table of critical values.
State the hypotheses. Choose the correct answer below.
A. Ho: P1 = P2 = P3
H1: At least one of the proportions is different from the others.
B. Ho: The categories of the variable and success and failure are independent.
H,: The categories of the variable and success and failure are dependent.
O C. Ho: The categories of the variable and success and failure are dependent.
H1: The categories of the variable and success and failure are independent.
D. Ho: H1 = E, and µ2 = E2 and H3 = E3
H1: At least one mean is different from what is expected.
%3D
Compute the value of the chi-square test statistic.
2
(Round to three decimal places as needed.)
Expert Solution
This question has been solved!
Explore an expertly crafted, step-by-step solution for a thorough understanding of key concepts.

This is a popular solution!

Trending now
This is a popular solution!

Step by step
Solved in 2 steps with 2 images

Recommended textbooks for you
Glencoe Algebra 1, Student Edition, 9780079039897…
Algebra
ISBN:
9780079039897
Author:
Carter
Publisher:
McGraw Hill
Glencoe Algebra 1, Student Edition, 9780079039897…
Algebra
ISBN:
9780079039897
Author:
Carter
Publisher:
McGraw Hill