The following table describes the market for waffles in Pawnee, Indiana. Quantity Price Quantity Supplied Demanded $0 150 $2 130 40 $4 110 80 $6 90 120 Use the information in the table to answer the questions below. Please enter your answers as numbers and not words. For price please enter your answer as a whole number (ie. 8 not "Eight" or "Eight dollars"). For quantity please enter your answer as a whole number as well (ie. 60 not "Sixty" or "Sixty waffles"). What is the equilibrium price for waffles in this market? What is the equilibrium quantity for waffles in this market?
The following table describes the market for waffles in Pawnee, Indiana. Quantity Price Quantity Supplied Demanded $0 150 $2 130 40 $4 110 80 $6 90 120 Use the information in the table to answer the questions below. Please enter your answers as numbers and not words. For price please enter your answer as a whole number (ie. 8 not "Eight" or "Eight dollars"). For quantity please enter your answer as a whole number as well (ie. 60 not "Sixty" or "Sixty waffles"). What is the equilibrium price for waffles in this market? What is the equilibrium quantity for waffles in this market?

Chapter5: Markets In Motion And Price Controls
Section: Chapter Questions
Problem 10P

Related questions
Question
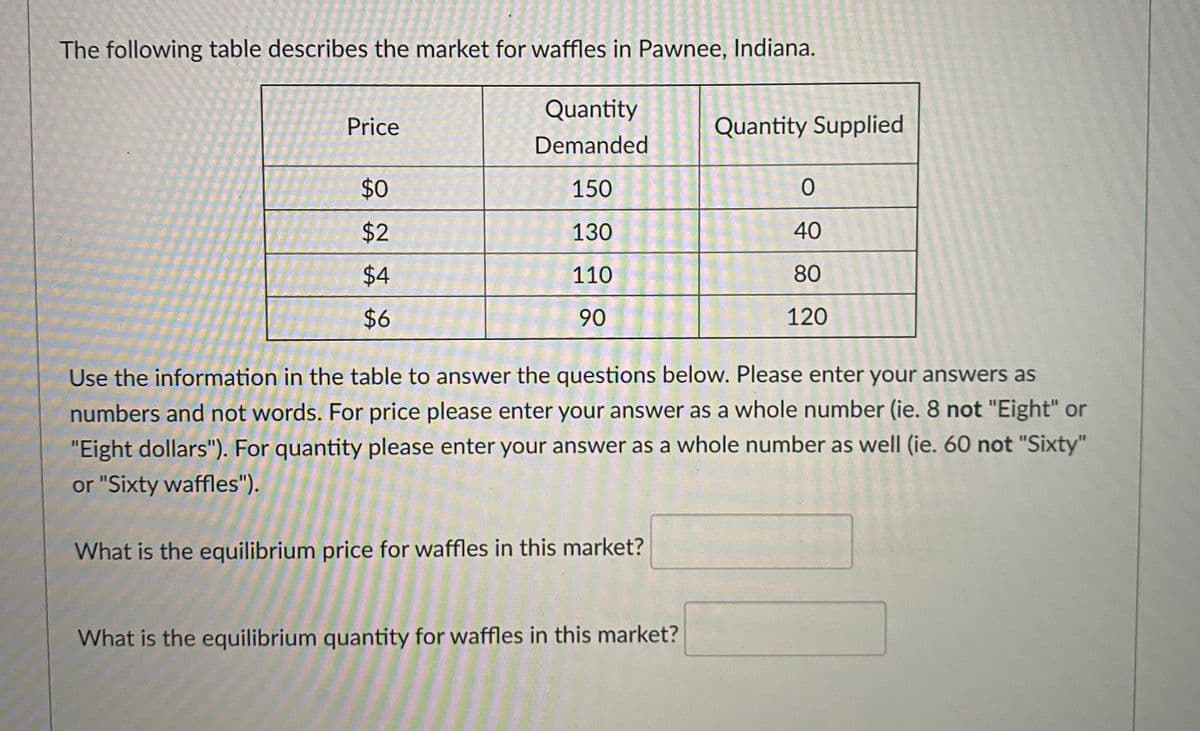
Transcribed Image Text:The following table describes the market for waffles in Pawnee, Indiana.
Quantity
Price
Quantity Supplied
Demanded
$0
150
130
40
110
80
$6
90
120
Use the information in the table to answer the questions below. Please enter your answers as
numbers and not words. For price please enter your answer as a whole number (ie. 8 not "Eight" or
"Eight dollars"). For quantity please enter your answer as a whole number as well (ie. 60 not "Sixty"
or "Sixty waffles").
What is the equilibrium price for waffles in this market?
What is the equilibrium quantity for waffles in this market?
2.
%24
%24
Expert Solution
Step 1
The demand curve shows the association between the amounts of a good or service demanded at each level of price.

Trending now
This is a popular solution!

Step by step
Solved in 2 steps with 1 images

Knowledge Booster


Learn more about
Need a deep-dive on the concept behind this application? Look no further. Learn more about this topic, economics and related others by exploring similar questions and additional content below.Recommended textbooks for you
Exploring Economics
Economics
ISBN:
9781544336329
Author:
Robert L. Sexton
Publisher:
SAGE Publications, Inc


Principles of Economics 2e
Economics
ISBN:
9781947172364
Author:
Steven A. Greenlaw; David Shapiro
Publisher:
OpenStax
Exploring Economics
Economics
ISBN:
9781544336329
Author:
Robert L. Sexton
Publisher:
SAGE Publications, Inc
Principles of Economics 2e
Economics
ISBN:
9781947172364
Author:
Steven A. Greenlaw; David Shapiro
Publisher:
OpenStax

Principles of Microeconomics
Economics
ISBN:
9781305156050
Author:
N. Gregory Mankiw
Publisher:
Cengage Learning

Microeconomics: Principles & Policy
Economics
ISBN:
9781337794992
Author:
William J. Baumol, Alan S. Blinder, John L. Solow
Publisher:
Cengage Learning

Principles of Economics, 7th Edition (MindTap Cou…
Economics
ISBN:
9781285165875
Author:
N. Gregory Mankiw
Publisher:
Cengage Learning