The following table gives information on the amount (in dollars) Of the electric bills for a samle of 40 families Electric bill Number of families 2 a) Draw the histograms. 4-8 12-16 14 8-12 16-20 20-24 11 8
The following table gives information on the amount (in dollars) Of the electric bills for a samle of 40 families Electric bill Number of families 2 a) Draw the histograms. 4-8 12-16 14 8-12 16-20 20-24 11 8

Algebra & Trigonometry with Analytic Geometry
13th Edition
ISBN:9781133382119
Author:Swokowski
Publisher:Swokowski
Chapter10: Sequences, Series, And Probability
Section10.7: Distinguishable Permutations And Combinations
Problem 16E

Related questions
Question
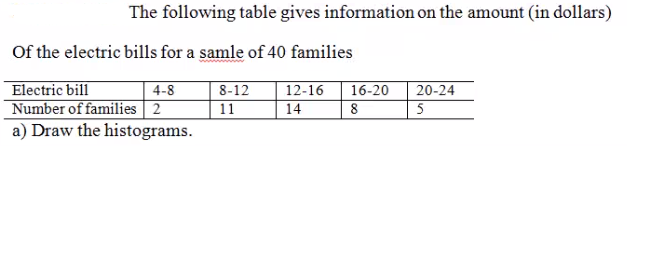
Transcribed Image Text:The following table gives information on the amount (in dollars)
Of the electric bills for a samle of 40 families
Electric bill
4-8
8-12
16-20
12-16
8
20-24
Number of families 2
11
14
a) Draw the histograms.
Expert Solution
This question has been solved!
Explore an expertly crafted, step-by-step solution for a thorough understanding of key concepts.

Step by step
Solved in 2 steps with 2 images

Knowledge Booster


Learn more about
Need a deep-dive on the concept behind this application? Look no further. Learn more about this topic, statistics and related others by exploring similar questions and additional content below.Recommended textbooks for you
Algebra & Trigonometry with Analytic Geometry
Algebra
ISBN:
9781133382119
Author:
Swokowski
Publisher:
Cengage

Linear Algebra: A Modern Introduction
Algebra
ISBN:
9781285463247
Author:
David Poole
Publisher:
Cengage Learning
Algebra & Trigonometry with Analytic Geometry
Algebra
ISBN:
9781133382119
Author:
Swokowski
Publisher:
Cengage
Linear Algebra: A Modern Introduction
Algebra
ISBN:
9781285463247
Author:
David Poole
Publisher:
Cengage Learning