The following table shows the running times (in minutes) of a sample of videotape versions of n 22 movies directed by Alfred Hitchcock. Movies are listed in alphabetical order. The data are in the Minitab columns "Hitchcock Movies" and "Running Times." Film Time Film Time The Birds 119 Psycho 108 Dial M for Murder 105 Rear Window 113 Family Plot 120 Rebecca 132 Foreign Correspondent 120 Rope 81 Frenzy 116 Shadow of a Doubt 108 I Confess 108 Spellbound 111 The Man Who Knew Too Much 120 Strangers on a Train 101 Marnie 130 To Catch a Thief 103 North by Northwest 136 Topaz 126 Notorious 103 Under Capricorn 117 The Paradise Cane 116 Vertigo 128 (a) By hand or with Minitab, calculate sample statistics for the mean, median, range, variance, and standard deviation using the running time data. (b) The sample range is almost 1 hour. What data point is the main influence behind this large range? (c) When plotted, the movie running times are fairly symmetric. How can you tell this without graphing the running times?
The following table shows the running times (in minutes) of a sample of videotape versions of n 22 movies directed by Alfred Hitchcock. Movies are listed in alphabetical order. The data are in the Minitab columns "Hitchcock Movies" and "Running Times." Film Time Film Time The Birds 119 Psycho 108 Dial M for Murder 105 Rear Window 113 Family Plot 120 Rebecca 132 Foreign Correspondent 120 Rope 81 Frenzy 116 Shadow of a Doubt 108 I Confess 108 Spellbound 111 The Man Who Knew Too Much 120 Strangers on a Train 101 Marnie 130 To Catch a Thief 103 North by Northwest 136 Topaz 126 Notorious 103 Under Capricorn 117 The Paradise Cane 116 Vertigo 128 (a) By hand or with Minitab, calculate sample statistics for the mean, median, range, variance, and standard deviation using the running time data. (b) The sample range is almost 1 hour. What data point is the main influence behind this large range? (c) When plotted, the movie running times are fairly symmetric. How can you tell this without graphing the running times?

Glencoe Algebra 1, Student Edition, 9780079039897, 0079039898, 2018
18th Edition
ISBN:9780079039897
Author:Carter
Publisher:Carter
Chapter10: Statistics
Section10.6: Summarizing Categorical Data
Problem 10CYU

Related questions
Question
100%
(a) By hand or with Minitab, calculate sample statistics for the mean, median, range , variance, and standard deviation using the running time data.
(b) The sample range is almost 1 hour. What data point is the main influence behind this large range?
(c) When plotted, the movie running times are fairly symmetric. How can you tell this without graphing the running times
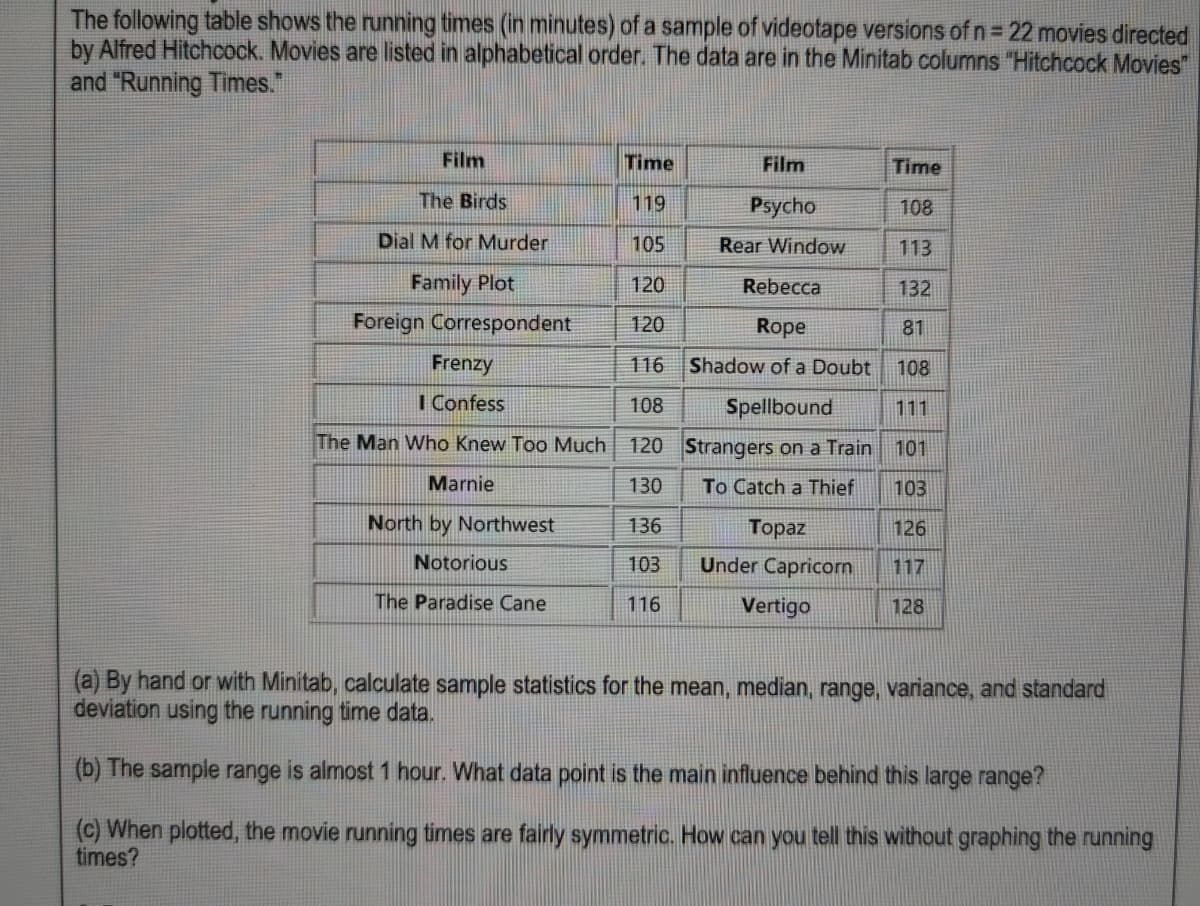
Transcribed Image Text:The following table shows the running times (in minutes) of a sample of videotape versions of n= 22 movies directed
by Alfred Hitchcock. Movies are listed in alphabetical order. The data are in the Minitab columns "Hitchcock Movies"
and "Running Times."
Film
Time
Film
Time
The Birds
119
Psycho
108
Dial M for Murder
105
Rear Window
113
Family Plot
120
Rebecca
132
Foreign Correspondent
120
Rope
81
Frenzy
116
Shadow of a Doubt
108
I Confess
108
Spellbound
111
The Man Who Knew Too Much
120 Strangers on a Train
101
Marnie
130
To Catch a Thief
103
North by Northwest
136
Topaz
126
Notorious
103
Under Capricorn
117
The Paradise Cane
116
Vertigo
128
(a) By hand or with Minitab, calculate sample statistics for the mean, median, range, variance, and standard
deviation using the running time data.
(b) The sample range is almost 1 hour. What data point is the main influence behind this large range?
(c) When plotted, the movie running times are fairly symmetric. How can you tell this without graphing the running
times?
Expert Solution
This question has been solved!
Explore an expertly crafted, step-by-step solution for a thorough understanding of key concepts.

This is a popular solution!

Trending now
This is a popular solution!

Step by step
Solved in 2 steps with 2 images

Recommended textbooks for you
Glencoe Algebra 1, Student Edition, 9780079039897…
Algebra
ISBN:
9780079039897
Author:
Carter
Publisher:
McGraw Hill

Holt Mcdougal Larson Pre-algebra: Student Edition…
Algebra
ISBN:
9780547587776
Author:
HOLT MCDOUGAL
Publisher:
HOLT MCDOUGAL
Glencoe Algebra 1, Student Edition, 9780079039897…
Algebra
ISBN:
9780079039897
Author:
Carter
Publisher:
McGraw Hill
Holt Mcdougal Larson Pre-algebra: Student Edition…
Algebra
ISBN:
9780547587776
Author:
HOLT MCDOUGAL
Publisher:
HOLT MCDOUGAL