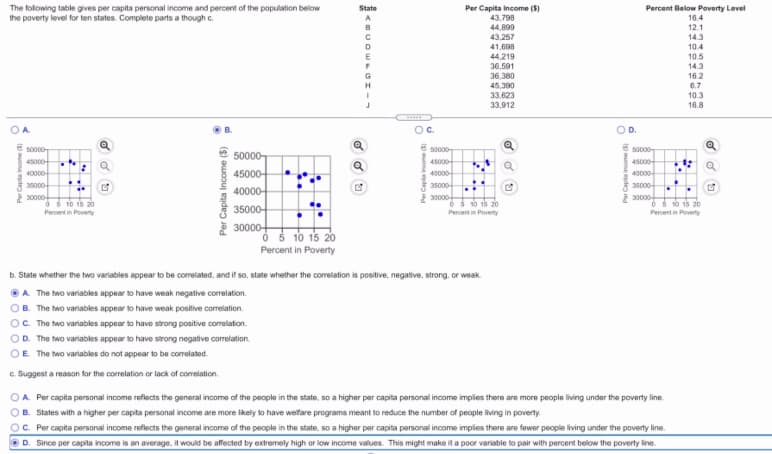
The following table gives per capita personal income and percent of the population below the poverty level for ten states. Complete parts a though c. State Per Capita income (5) 43,798 44,890 43.257 Percent Below Poverty Level 16.4 A 12.1 14.3 41,698 10.4 44,219 10.5 36,591 36,380 45,390 33,623 33.912 14.3 16.2 6.7 10.3 16.8 OA Oc. D. 50000 50000 50000- 50000 45000- 45000 45000- 40000- 45000- 40000- aso00- 2 30000- 40000- 36000 230000 35000 40000- ở6 to is 20 35000- 2 30000- Percent in Poverty Percent in Povety Percent n Poverty O 10 15 20 Percent in Poverty b. State whether the two variables appear to be correlated, and if so, state whether the corelation is positive, negative, strong, or weak. OA The two variables appear to have weak negative correlation. OB. The two variables appear to have weak positive corelation. O. The two variables appear to have strong positive corelation. OD. The two variables appear to have strong negative corelation. OE The two variables do not appear to be correlated. e. Suggest a reason for the correlation or lack of comelation. OA Per capita personal income reflects the general income of the people in the state, so a higher per capita personal income implies there are more people living under the poverty line. OB States with a higher per capita personal income are more likely to have welfare programs meant to reduce the number of people living in poverty. OC Per capita personal income reflects the general income of the people in the state, so a higher per capita personal income imples there are fawer people living under the poverty line. OD. Since per capita income is an average, it would be affected by extremely high or low income values. This might make it a poor variable to pair with percent below the poverty line. Per Capta inoome (S) Per Capita Income ($)
The following table gives per capita personal income and percent of the population below the poverty level for ten states. Complete parts a though c. State Per Capita income (5) 43,798 44,890 43.257 Percent Below Poverty Level 16.4 A 12.1 14.3 41,698 10.4 44,219 10.5 36,591 36,380 45,390 33,623 33.912 14.3 16.2 6.7 10.3 16.8 OA Oc. D. 50000 50000 50000- 50000 45000- 45000 45000- 40000- 45000- 40000- aso00- 2 30000- 40000- 36000 230000 35000 40000- ở6 to is 20 35000- 2 30000- Percent in Poverty Percent in Povety Percent n Poverty O 10 15 20 Percent in Poverty b. State whether the two variables appear to be correlated, and if so, state whether the corelation is positive, negative, strong, or weak. OA The two variables appear to have weak negative correlation. OB. The two variables appear to have weak positive corelation. O. The two variables appear to have strong positive corelation. OD. The two variables appear to have strong negative corelation. OE The two variables do not appear to be correlated. e. Suggest a reason for the correlation or lack of comelation. OA Per capita personal income reflects the general income of the people in the state, so a higher per capita personal income implies there are more people living under the poverty line. OB States with a higher per capita personal income are more likely to have welfare programs meant to reduce the number of people living in poverty. OC Per capita personal income reflects the general income of the people in the state, so a higher per capita personal income imples there are fawer people living under the poverty line. OD. Since per capita income is an average, it would be affected by extremely high or low income values. This might make it a poor variable to pair with percent below the poverty line. Per Capta inoome (S) Per Capita Income ($)

Glencoe Algebra 1, Student Edition, 9780079039897, 0079039898, 2018
18th Edition
ISBN:9780079039897
Author:Carter
Publisher:Carter
Chapter10: Statistics
Section10.5: Comparing Sets Of Data
Problem 26PFA

Related questions
Question
Are my answers correct? If not what are the answers and why?
Transcribed Image Text:State
The following table gives per capita personal income and percent of the population below
the poverty level for ten states. Complete parts a though c.
Per Capita Income (5)
43,798
44,899
Percent Below Poverty Level
16.4
12.1
14.3
43,257
41,698
44,219
36,591
36,380
D
10.4
10.5
14.3
45,390
33,623
33,912
16.2
6.7
10.3
16.8
OA
Oc.
O D.
E sop00-
50000-
45000-
45000-
45000-
40000
45000-
40000-
40000
3500-
35000-
35000
40000-
2 3000o
2 30000
6 0 1s 20
230000
35000-
Peront in Poverty
Percent in Povety
Percent in Poverty
2 30000-
Ó 5 10 15 20
Percent in Poverty
b. State whether the two variables appear to be correlated, and if so, state whether the corelation is positive, negative, strong, or weak.
OA The two variables appear to have weak negative correlation.
B. The two variables appear to have weak positive correlation.
C. The two variablos appear to have strong positive correlation.
OD. The two variables appear to have strong negative correlation.
OE The two variables do not appear to be correlated.
e. Suggest a reason for the correlation or lack of correlation.
A. Per capita personal income reflects the general income of the people in the state, so a higher per capita personal income implies there are more people living under the poverty line.
B. States with a higher per capita personal income are more likely to have welfare programs meant to reduce the number of people living in poverty.
OC. Per capita personal income reflects the general income of the people in the state, so a higher per capita personal income implies there are fewer people living under the poverty line.
D. Since per capita income is an average, it would be affected by extremely high or low income values. This might make it a poor variable to pair with percent below the poverty line.
Per Capta income (5
Per Capita Income ($)
()m den
Per Capta income (5
Expert Solution
This question has been solved!
Explore an expertly crafted, step-by-step solution for a thorough understanding of key concepts.

This is a popular solution!

Trending now
This is a popular solution!

Step by step
Solved in 2 steps with 2 images

Recommended textbooks for you
Glencoe Algebra 1, Student Edition, 9780079039897…
Algebra
ISBN:
9780079039897
Author:
Carter
Publisher:
McGraw Hill
Glencoe Algebra 1, Student Edition, 9780079039897…
Algebra
ISBN:
9780079039897
Author:
Carter
Publisher:
McGraw Hill