Consider the following population table. 1970 1980 1990 2000 2010 2020 State A 11,110,485 11,427,509 11,430,702 12,051,783 12,916,994 13,236,820 State B 8,881,926 9,263,044 9,295,297 9,679,252 | 10,428,883 10,695,893 State C 5,195,392 5,490,212 5,544,259 6,045,521 | 6,392,139 6,627,108 State D 3,806,103 4,075,870 4,375,299 4,830,584 5,420,536 5,900,869 How much did the population of State C increase from 2000 to 2010? The population of State C is increased by реople.
Consider the following population table. 1970 1980 1990 2000 2010 2020 State A 11,110,485 11,427,509 11,430,702 12,051,783 12,916,994 13,236,820 State B 8,881,926 9,263,044 9,295,297 9,679,252 | 10,428,883 10,695,893 State C 5,195,392 5,490,212 5,544,259 6,045,521 | 6,392,139 6,627,108 State D 3,806,103 4,075,870 4,375,299 4,830,584 5,420,536 5,900,869 How much did the population of State C increase from 2000 to 2010? The population of State C is increased by реople.

Advanced Engineering Mathematics
10th Edition
ISBN:9780470458365
Author:Erwin Kreyszig
Publisher:Erwin Kreyszig
Chapter2: Second-order Linear Odes
Section: Chapter Questions
Problem 1RQ

Related questions
Question
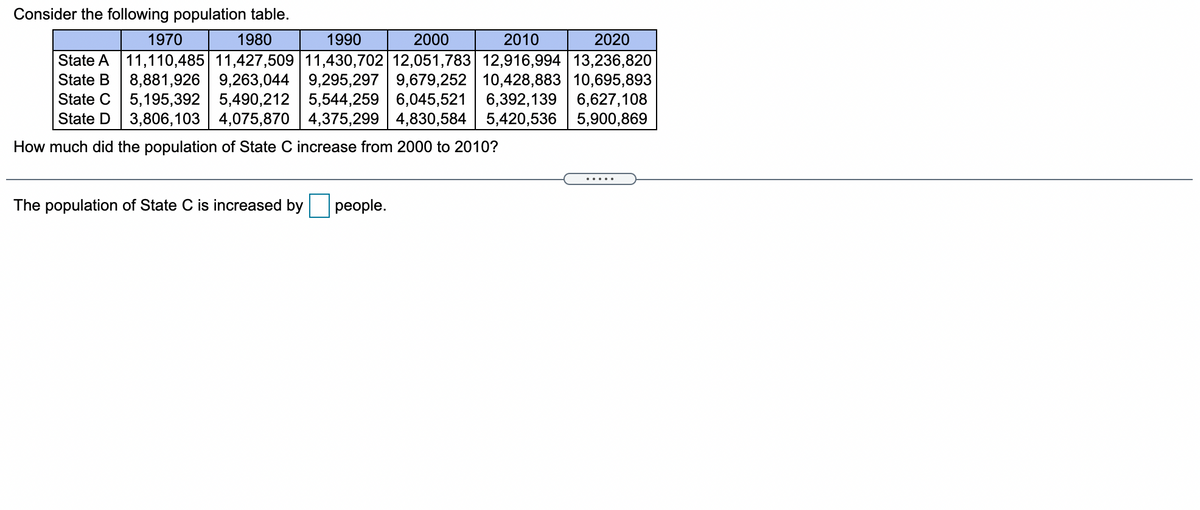
Transcribed Image Text:Consider the following population table.
1970
1980
1990
2000
2010
2020
State A 11,110,485 11,427,509 11,430,702 12,051,783 12,916,994 13,236,820
State B
8,881,926 9,263,044 9,295,297 9,679,252 10,428,883 10,695,893
6,392,139 6,627,108
State C 5,195,392 5,490,212 5,544,259 | 6,045,521
State D 3,806,103 4,075,870 | 4,375,299 4,830,584 5,420,536 | 5,900,869
How much did the population of State C increase from 2000 to 2010?
The population of State C is increased by
реople.
Expert Solution
This question has been solved!
Explore an expertly crafted, step-by-step solution for a thorough understanding of key concepts.

This is a popular solution!

Trending now
This is a popular solution!

Step by step
Solved in 2 steps

Recommended textbooks for you
Advanced Engineering Mathematics
Advanced Math
ISBN:
9780470458365
Author:
Erwin Kreyszig
Publisher:
Wiley, John & Sons, Incorporated

Numerical Methods for Engineers
Advanced Math
ISBN:
9780073397924
Author:
Steven C. Chapra Dr., Raymond P. Canale
Publisher:
McGraw-Hill Education

Introductory Mathematics for Engineering Applicat…
Advanced Math
ISBN:
9781118141809
Author:
Nathan Klingbeil
Publisher:
WILEY
Advanced Engineering Mathematics
Advanced Math
ISBN:
9780470458365
Author:
Erwin Kreyszig
Publisher:
Wiley, John & Sons, Incorporated
Numerical Methods for Engineers
Advanced Math
ISBN:
9780073397924
Author:
Steven C. Chapra Dr., Raymond P. Canale
Publisher:
McGraw-Hill Education
Introductory Mathematics for Engineering Applicat…
Advanced Math
ISBN:
9781118141809
Author:
Nathan Klingbeil
Publisher:
WILEY

Mathematics For Machine Technology
Advanced Math
ISBN:
9781337798310
Author:
Peterson, John.
Publisher:
Cengage Learning,

