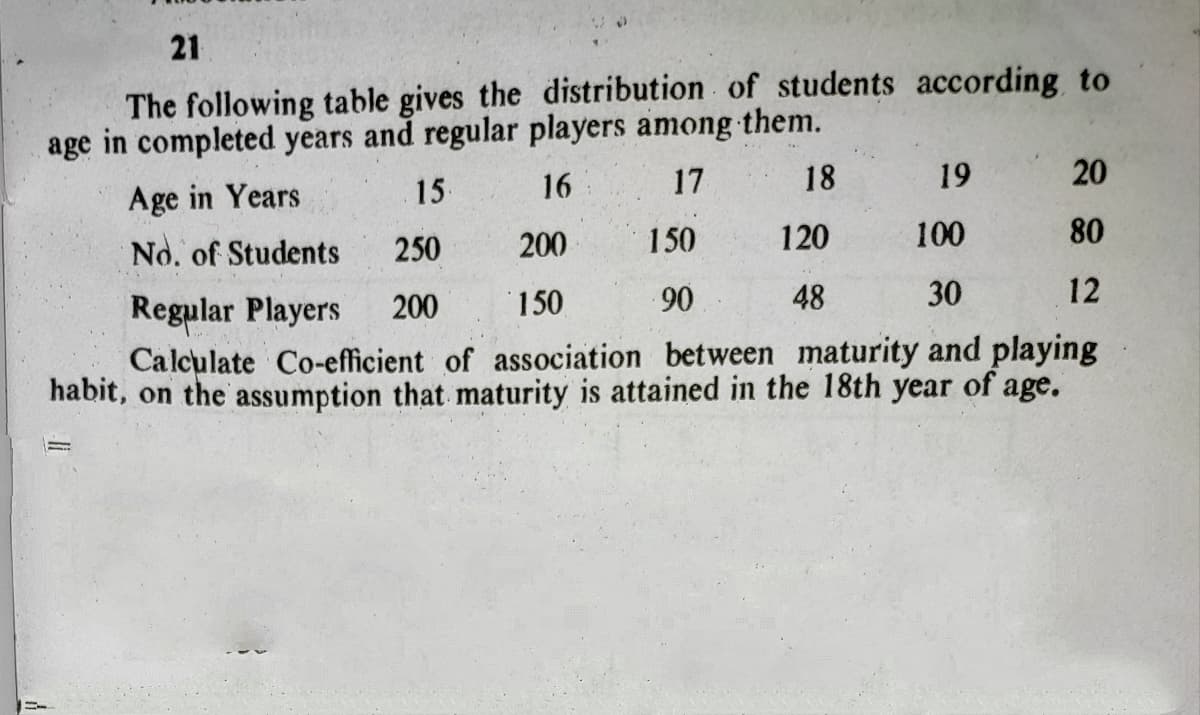
The following table gives the distribution of students according to age in completed years and regular players among them. Age in Years 15 16 17 18 19 20 No. of Students 250 200 150 120 100 80 Regular Players Calculate Co-efficient of association between maturity and playing habit, on the assumption that maturity is attained in the 18th year of age. 200 150 90 48 30 12


Q: Study is conducted involving 14 infants to investigate the association between gestational age at…
A: Correlation is used to find the association between two variables which can be obtained using excel…
Q: The following table was presented in an article summarizing a study to compare a new drug to a…
A:
Q: Consider a population with the following properties. i. No one in the population is both old and…
A: Solution is in the attachment below
Q: 2. A real estate company surveyed the Middleton community of 26 homes and collected the following…
A: a. What are the minimum and maximum values of the value of house of the people? First, enter this…
Q: Based from a study to a certain player using Ald in Rank Game, the No. of Stack collected by the…
A: The Lagrange's interpolation formula is given by…
Q: The following binary data represent the students taking a statistics course in a major university,…
A: Introduction: Denote p̂ as the sample proportion of students represented by “1”, that is, for…
Q: The following table presents results from a simulated shopping and in-home product use test for a…
A: Given: Charmin All Purpose Charmin Private Label Totals Charmin All Purpose 100 80…
Q: The following binary data represent the students taking a statistics course in a major university,…
A: Given Information: Consider p as the proportion of students represented by "1" for students who are…
Q: 2. The following data represent the Statistics grades for a random sample of 12 freshman-nursing…
A: Introduction: It is required to obtain Spearman’s rank correlation coefficient.
Q: NO AGE - SEX:- PROGRAMME- Hours spent study GPA 23 Male BB05 4 3.67 2 21 Female ВвO8 ЗА 2 3.90 22…
A: Solution: First step to find the mean and standard deviation of hours spend for studying and current…
Q: [M] A Landsat image with three spectral components was made of Homestead Air Force Base in Florida…
A:
Q: 1. The following data show the effect of four operators chosen randomly, on the output of a…
A: Given : sample size: n=16 Sample mean:…
Q: hypothesizes that people with a shorter commute time will have higher degrees of job satisfaction.…
A:
Q: Shall we reject or not reject the claim that there is no difference in population mean annual…
A: Let μ1,μ2,μ3 denotes the population mean annual profits per employee in each of the three types of…
Q: The weights of some IEM students and IEC students (two kinds of IE students) before they stopped…
A: Given: The provided data is as follows: For IEC Students: Before 119 142 151 118 135 After 121…
Q: Question 13, JUST LETTER D. I have the rest. Thank you!
A: d).
Q: The following table gives the experience (in years) and the number of computers sold during the…
A:
Q: - The following table gives the distribution of students according to age in completed years and…
A:
Q: The following table contains data from a random sample of 12 states and lists expenditures (in…
A: Boxplot can be constructed using Excel: Enter the data in Excel sheet, select the data, Go to…
Q: If a researcher randomly assigns participants to one of two conditions, that researcher is likely to…
A: 1.A correlational design measures a relationship between the two or more variables, and if so, in…
Q: The following information is available for two samples selected from independent normally…
A: Given : Population A: n1=30 S^21=27 Population B: n2=31 S^22=54
Q: 11.27 B A firm that prints automobile bumper stickers conducts a study to investigate the relation…
A: Solution:c.Residual standard deviation:The residual standard deviation is the standard deviation of…
Q: Here is a bivariate data set in which you believe y to be the response variable. x y 56.1 60.4 60.5…
A: Enter the data in Excel.
Q: A random sample of companies in electric utilities (I), financial services (II), and food processing…
A: State the hypotheses.
Q: The following is a chart of 25 baseball players' salaries and statistics from 2019. Player Name…
A: As per our guidelines, we are allowed to answer first three sub-parts only. Thanks a) In order to…
Q: Consider the following data generated by Company A in reviewing its SalesIMarketing operations and…
A: Let us define a multiple linear regression model.Yi=β0 + β1X1i + β2X2i + β3X3i + β4X4i + β5X5i +…
Q: Product Calories Sugar A 340 13.3 B 430 2.8 C 450 25.3 D 500 26.6 E 530 19.2 F 580 26.0 G 590 23.2
A: The given data is Product Calories Sugar A 340 13.3 B 430 2.8 C 450 25.3 D 500 26.6 E…
Q: The following table shows 1000 nursing school applicants classified according to scores made on a…
A:
Q: The following data show Transportation Budget for North Carolina (Let year 1- 2003) Year = 2003…
A: Hi! Thank you for the question, as per the honor code, we are allowed to answer three sub-parts at a…
Q: A random sample of companies in electric utilities (I), financial services (II), and food processing…
A: Null Hypothesis: H0: The mean annual profits per employee in each of the three types of companies…
Q: A poll surveyed people in six countries to assess attitudes toward a variety of alternate forms of…
A: a) Given data, The sample size is 6451. Null hypothesis: The attitude toward building new nuclear…
Q: 1,000 students at college level are graded according to their 1.Q. and their economic conditions.…
A:
Q: An article in Technometrics presented the following data on the motor fuel several blends of…
A:
Q: 5. Ateam leader tracks the number of items produced by three workers who each work on three…
A: Introduction: We need to perform three tests- the effect of the machine on the number of items…
Q: Is there reasan to believe that the life expected of Group A and Group B is same or not from the…
A: Expected value represents the population mean. So it is asked that whether the population mean of…
Q: Suppose a researcher is interested in investigating the effectiveness of a new medication aimed to…
A: Note: Hey, there! Thank you for the question. Since the sample size is small and population standard…
Q: 2. Use the sign test on the data given below to determine whether there is a statistical increase in…
A: Data is given to test that, if there is an increase in the values produced by treatment A over those…
Q: Let X1, X2,..., X3 denote a random sample from a population having mean u and variance o?. Which of…
A: Given . A random sample from a population having mean μ and variance σ2 We have to find which of the…
Q: A certain manufacturing company has the following data on quantities shipped and unit costs for each…
A: Given that, Products Base-Period Quantities (Year 1) Mean…
Q: A random sample of companies in electric utilities (I), financial services (II), and food processing…
A: According to the provided information, a random sample of companies in electric utilities are…
Q: A random sample of companies in electric utilities (I), financial services (II), and food processing…
A: (a) The level of significance is the measure of probability of rejecting null hypothesis when it…
Q: A landscaping company has collected data on home values (in thousands of $) and expenditures (in…
A: Let x = home value (in thousands of $), and let y = landscaping expenditures (in thousands of $)
Q: The National Safety Council released the following data on the incidence rates for fatal or…
A: Here the given dataset is listed below Industry Year 1 Year 2 Year 3 Textile 0.46 0.48 0.69…
Q: The following are the number of babies born during a year in 60 community hospitals.…
A: Arrange given data in ascending order…
Q: The table below contains the covariance matrix of stock returns and the market. Assume that the…
A: Given data, The table below contains the covariance matrix of stock returns and the market. Assume…
Q: The table below shows worldwide smart phone sales by vendor. Worldwide Smartphone Sales to End Users…
A: Given
Q: 1. The following data were obtained in a study of the relationship between the weight and chest size…
A: As per guidelines we will solve the first question only, please repost other questions for more…
Q: In a study of reaction times of dogs to a specific stimulus, an animal trainer obtained the…
A:
Q: The following data show the number of class sessions missed during a semester of SOC221 and the…
A:
Q: In a study of the effectiveness of physical exercise in weight reduction, a group of 12 persons…
A:


Trending now
This is a popular solution!

Step by step
Solved in 2 steps with 2 images

- The National Safety Council of the U.S. released the following data on the incidence rates for fatal or lost-worktime injuries per 100 employees for several industries in three recent years. Compute r for each pair of years and determine which years are most highly correlated. Calculate r using 1. the formula and 2. function. Industry Year 1 Year 2 Year 3 Textile 0.46 0.48 0.69 Chemical 0.52 0.62 0.63 Communication 0.9 0.72 0.81 Machinery 1.5 1.74 2.1 Services 2.89 2.03 2.46 Nonferrous metals 1.8 1.92 2 Food 3.29 3.18 3.17 Government 5.73 4.43 4 By formula By Function By formula By Function r1 r2 r3 Please provide a step by step of calculation in excelto give me an understaning on how to calculate in future Thank you in advanceA random sample of companies in electric utilities (I), financial services (II), and food processing (III) gave the following information regarding annual profits per employee (units in thousands of dollars). I II III 49.9 55.4 39.2 43.9 25.0 37.5 32.7 41.9 10.1 27.8 29.6 32.6 38.1 39.6 15.7 36.5 42.3 20.5 Find SSTOT, SSBET, and SSW and check that SSTOT = SSBET + SSW. (Use 3 decimal places.) SSTOT = SSBET = SSW = Find d.f.BET, d.f.W, MSBET, and MSW. (Use 3 decimal places for MSBET, and MSW.) dfBET = dfW = MSBET = MSW = Find the value of the sample F statistic. (Use 3 decimal places.) What are the degrees of freedom? Find the P-value of the sample test statistic. Make a summary table for your ANOVA test.A researcher is interested in testing the relationship between smoking and BMI (kg/m2) in adults aged 30-45. In order to test this association, the researcher divides smoking into currently more than a pack a day, currently less than a pack a day, and never smokers. The following table represents the BMIs for each participant enrolled by their respective smoking category. Current Smoker (≥1pack/day) Current Smoker (<1 pack/day Never Smoked 26.7 29.4 22.1 29.4 28.6 30.4 24.3 27.4 21.3 28.4 23.2 26.4 21.6 20.1 19.7 27.4 20.6 19.8 26.8 19.7 21.6 36.4 19.6 22.3 31.5 21.6 24.3 27.4 21.5 *Continue as though all assumptions for ANOVA are met. A) Calculate the MSW and MSB for the data represented above. B) Carry out a formal test for a one-way analysis of variance among the groups and interpret your results.
- Marine biologists have noticed that the color of the outermost growth band on a clam tends to be related to the time of year in which the clam dies. A biologist conducted a small investigation of whether this is true for the species Protothaca staminea. She collected a sample of 50 clam shells in February and 27 clam shells in March. 15 of the shells from February had a dark color on the outermost growth band, whereas 8 of the shells from March had a dark color on the outermost growth band. Carry out a hypothesis test to see if there is a difference in the proportion of shells with a dark outermost growth band between the two months. The point estimate for the true difference in proportion of dark growth bands between February and March is:Marine biologists have noticed that the color of the outermost growth band on a clam tends to be related to the time of year in which the clam dies. A biologist conducted a small investigation of whether this is true for the species Protothaca staminea. She collected a sample of 50 clam shells in February and 27 clam shells in March. 15 of the shells from February had a dark color on the outermost growth band, whereas 8 of the shells from March had a dark color on the outermost growth band. Carry out a hypothesis test to see if there is a difference in the proportion of shells with a dark outermost growth band between the two months. Let ? = 0.01. A) The point estimate for the true difference in proportion of dark growth bands between February and March is:Marine biologists have noticed that the color of the outermost growth band on a clam tends to be related to the time of year in which the clam dies. A biologist conducted a small investigation of whether this is true for the species Protothaca staminea. She collected a sample of 50 clam shells in February and 27 clam shells in March. 15 of the shells from February had a dark color on the outermost growth band, whereas 8 of the shells from March had a dark color on the outermost growth band. Carry out a hypothesis test to see if there is a difference in the proportion of shells with a dark outermost growth band between the two months. Let ? = 0.01.Note: Do all calculations as February - March A) The point estimate for the true difference in proportion of dark growth bands between February and March is: I need help and webassign rejected the 0.0037 as the answer. I'm so lost. I emailed my professor and he hasn't gotten back to me. Please help. Thank you.
- From the analysis of wages paid to employees in two service organizations X and Y, the following were obtained: Organization X Organization YNumber of wage earners 550 650Average monthly earnings 5,000 4,500Variance of the distribution of wages 900 1600 (i) Which organization pays a larger amount as monthly wages? (ii) In which organization is there greater variability in individual wages of all the wage earners taken together?The following data show the number of class sessions missed during a semester of SOC221 and the final grade for a sample of 8 students selected at random. Number of Sessions Missed Final Grade (x) (y) 0 96 2 88 12 68 6 91 8…The following data are from a random sample of 10 students who participated in a study undertaken to investigate the effect of sleep time (measured in average number of hours of sleep per night) on GPA (grade point average, measured on a 4-point scale). Student Sleep time GPA 1 7 3.28 2 9 3.16 3 8 3.75 4 6 2.50 5 4 2.45 6 8 2.91 7 7 3.53 8 6 3.02 9 3 2.30 10 8 3.48 a. Find the equation between GPA (y) as function of sleep time (x). b. What is the estimated GPA of a student who averages 5 hours of sleep per night? c. What is the coefficient of determination? *(no use EXCEL)
- Consider the following datax -5 -4 -3 -2 -1 0 1 2 3 4 5Y - 125 - 64 - 27 -8 -1 0 1 8 27 64 125a. Calculate the correlation between x and y, and perform a hypothesis test to determine if the correlation is significantly greater than zero. Use a significance level of 5%.b. Are you willing to conclude that there is a strong linear association between the two variables? Use at least one graph to support your answer, and to explain why or why not.A suburban hotel derives its revenue from its hotel and restaurant operations. The owners are interested in the relationship between the number of rooms occupied on a nightly basis and the revenue per day in the restaurant. Below is a sample of 25 days (Monday through Thursday) from last year showing the restaurant income and number of rooms occupied. Day Revenue Occupied Day Revenue Occupied 1 $ 1,452 23 14 $ 1,425 27 2 1,361 47 15 1,445 34 3 1,426 21 16 1,439 15 4 1,470 39 17 1,348 19 5 1,456 37 18 1,450 38 6 1,430 29 19 1,431 44 7 1,354 23 20 1,446 47 8 1,442 44 21 1,485 43 9 1,394 45 22 1,405 38 10 1,459 16 23 1,461 51 11 1,399 30 24 1,490 61 12 1,458 42 25 1,426 39 13 1,537 54 Click here for the Excel Data File Choose the…Subject Extroversion Neuroticism 1 43 49 2 46 53 3 48 67 4 48 57 5 48 56 6 50 48 7 51 60 8 51 41 9 53 51 10 58 47 11 62 41 12 63 51 13 63 30 14 63 28 15 67 55 16 67 47 17 67 39 4. What is the lower bound of the Fisher's z-transformed population correlation coefficient (zeta) calculated from the data in personalities.xls? 5. What is the upper bound of the Fisher's z-transformed population correlation coefficient (zeta) calculated from the data in personalities.xls? 6. What is the lower bound of the population correlation coefficient (rho) calculated from the data in personalities.xls?
