The following table gives the estimated stature (length, in cm) of human fetuses at various times (in weeks) since conception. y 18 19.71 20 21.43 22 25.15 24 27.87 26 31.09 28 33.81 30 34.53 32 39.25 34 39.97 36 42,69 38 47.41 40 48.13 Use Desmos (watch the video if you need help) to find the least squares line and the coefficient of correlation. a) Find the coefficient of correlation, Round to three decimal places. b) Give the equation of the least squares line. Round the coefficients to 2 decimal places as needed. C) According to the least squares line, how much is the fetal stature increasing per week, on average? The fetal stature is increasing by cm per week, according to the least square
The following table gives the estimated stature (length, in cm) of human fetuses at various times (in weeks) since conception. y 18 19.71 20 21.43 22 25.15 24 27.87 26 31.09 28 33.81 30 34.53 32 39.25 34 39.97 36 42,69 38 47.41 40 48.13 Use Desmos (watch the video if you need help) to find the least squares line and the coefficient of correlation. a) Find the coefficient of correlation, Round to three decimal places. b) Give the equation of the least squares line. Round the coefficients to 2 decimal places as needed. C) According to the least squares line, how much is the fetal stature increasing per week, on average? The fetal stature is increasing by cm per week, according to the least square

Linear Algebra: A Modern Introduction
4th Edition
ISBN:9781285463247
Author:David Poole
Publisher:David Poole
Chapter7: Distance And Approximation
Section7.3: Least Squares Approximation
Problem 34EQ

Related questions
Question
I need the answer quickly
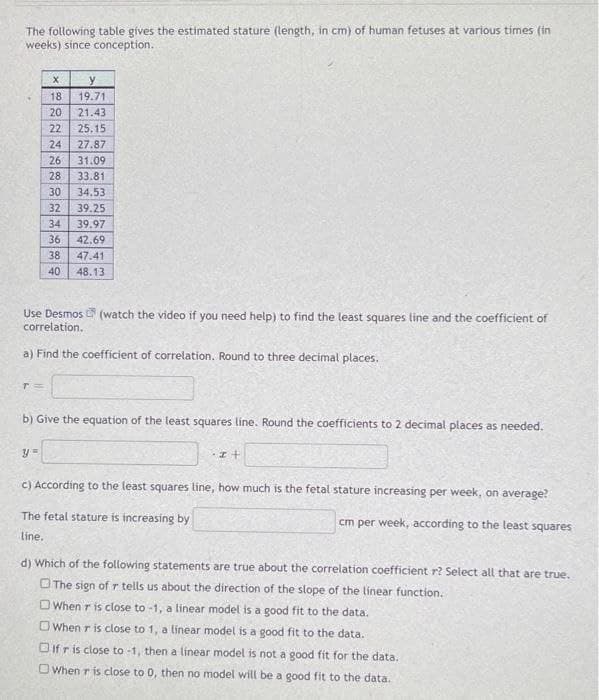
Transcribed Image Text:The following table gives the estimated stature (length, in cm) of human fetuses at various times (in
weeks) since conception.
18
19.71
20
21.43
22
25.15
24
27.87
26
31.09
28
33.81
30
34.53
32
39.25
34
39.97
36
42.69
38
47.41
40
48.13
Use Desmos (watch the video if you need help) to find the least squares line and the coefficient of
correlation.
a) Find the coefficient of correlation. Round to three decimal places.
b) Give the equation of the teast squares line. Round the coefficients to 2 decimal places as needed.
C) According to the least squares line, how much is the fetal stature increasing per week, on average?
The fetal stature is increasing by
cm per week, according to the least squares
line.
d) Which of the following statements are true about the correlation coefficient r? Select all that are true.
O The sign of r tells us about the direction of the slope of the linear function.
OWhen r is close to -1, a linear model is a good fit to the data.
O When r is close to 1, a línear model is a good fit to the data.
Oifris close to -1, then a linear model is not a good fit for the data.
OWhen r is close to 0, then no model will be a good fit to the data.
Expert Solution
This question has been solved!
Explore an expertly crafted, step-by-step solution for a thorough understanding of key concepts.

This is a popular solution!

Trending now
This is a popular solution!

Step by step
Solved in 2 steps with 2 images

Recommended textbooks for you
Linear Algebra: A Modern Introduction
Algebra
ISBN:
9781285463247
Author:
David Poole
Publisher:
Cengage Learning

Algebra & Trigonometry with Analytic Geometry
Algebra
ISBN:
9781133382119
Author:
Swokowski
Publisher:
Cengage
Linear Algebra: A Modern Introduction
Algebra
ISBN:
9781285463247
Author:
David Poole
Publisher:
Cengage Learning
Algebra & Trigonometry with Analytic Geometry
Algebra
ISBN:
9781133382119
Author:
Swokowski
Publisher:
Cengage