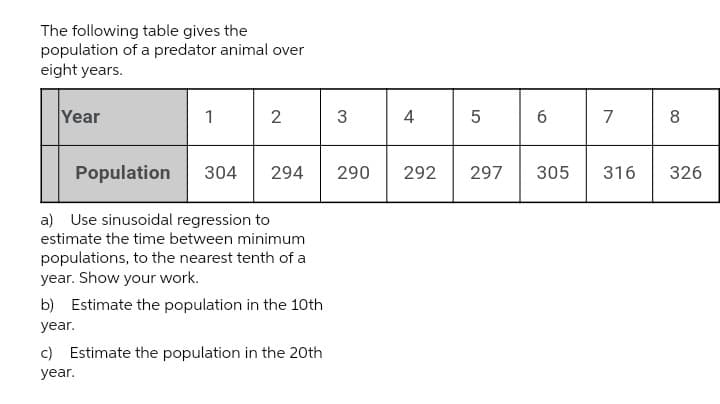
The following table gives the population of a predator animal over eight years. Year 1 2 Population 304 294 a) Use sinusoidal regression to estimate the time between minimum populations, to the nearest tenth of a year. Show your work. b) Estimate the population in the 10th year. c) Estimate the population in the 20th year. 3 290 4 5 6 292 297 305 7 316 8 326
The following table gives the population of a predator animal over eight years. Year 1 2 Population 304 294 a) Use sinusoidal regression to estimate the time between minimum populations, to the nearest tenth of a year. Show your work. b) Estimate the population in the 10th year. c) Estimate the population in the 20th year. 3 290 4 5 6 292 297 305 7 316 8 326

Algebra & Trigonometry with Analytic Geometry
13th Edition
ISBN:9781133382119
Author:Swokowski
Publisher:Swokowski
Chapter7: Analytic Trigonometry
Section7.6: The Inverse Trigonometric Functions
Problem 93E

Related questions
Question
Please solve all parts correct as soon as possible
Transcribed Image Text:The following table gives the
population of a predator animal over
eight years.
Year
1
2
Population
304 294
a) Use sinusoidal regression to
estimate the time between minimum
populations, to the nearest tenth of a
year. Show your work.
b) Estimate the population in the 10th
year.
c) Estimate the population in the 20th
year.
3
4
290 292
5
297
6
305
7
316
8
326
Expert Solution
This question has been solved!
Explore an expertly crafted, step-by-step solution for a thorough understanding of key concepts.

Step by step
Solved in 4 steps with 1 images

Recommended textbooks for you
Algebra & Trigonometry with Analytic Geometry
Algebra
ISBN:
9781133382119
Author:
Swokowski
Publisher:
Cengage

Trigonometry (MindTap Course List)
Trigonometry
ISBN:
9781337278461
Author:
Ron Larson
Publisher:
Cengage Learning
Algebra & Trigonometry with Analytic Geometry
Algebra
ISBN:
9781133382119
Author:
Swokowski
Publisher:
Cengage
Trigonometry (MindTap Course List)
Trigonometry
ISBN:
9781337278461
Author:
Ron Larson
Publisher:
Cengage Learning