What is the first variable to enter in the stepwise regression? [Select] How many variables entered in the entire process? [Select] What do you notice about R2 when you increase the number of variables? [Select]
What is the first variable to enter in the stepwise regression? [Select] How many variables entered in the entire process? [Select] What do you notice about R2 when you increase the number of variables? [Select]

MATLAB: An Introduction with Applications
6th Edition
ISBN:9781119256830
Author:Amos Gilat
Publisher:Amos Gilat
Chapter1: Starting With Matlab
Section: Chapter Questions
Problem 1P

Related questions
Question
Transcribed Image Text:opy
Clear"
Delete
Clipboard/Data
|N=54
Intercept
pindex
enzyme
bloodclot
#
Copy Down
Move Screen
Variables Cases
Catcher
➜Go To
Copy Right
▾
Find/Replace
Fill
Standardize
Regression Summary for Dependent Variable: logsurvival (Sheet1 in data_surviv
R=.90619016 R²= .82118061 Adjusted R²= .80658311
F(4.49)-56.255 p<.00000 Sid.Error of estimate: .11670
bº
b
1(49)
p-value
Std.Err.
of bº
Sid. Err.
of b
0.130226
0.663195
5.092654
0.000006
0.139684
0.091862
0.034628
0.022773
1.520590
0.134790
0.560623 0.068441 0.008801
0.001074 8.191352 0.000000
0.585219 0.077613 0.006989 0.000927
7.540169
0.000000
0.364904 0.085766 0.060401 0.014197 4.254645 0.000094
Summary of Stepwise Regression; DV: logsurvival (Sheet1 in data_survival)
Multiple R. Variable
Regressiver
Sumn pindex
Step Multiple
Multiple R-square
F-10
p-value Variables
+in/-out R R-square change entr/rem
included
11 0.684191
0.468118
0.468118
45.76597 0.000000
2 0.783378 0.613681 0.145564 19.21663 0.000058
3 0.868976 0.755120 0.141438 28.87909 0.000002
40.906190 0.821181 0.066061 18.10200 0.000094
enzyme
Regre bloodclot
Sumn
Summary Statistics, DV logsunval (Sheet1 in data sunwal) Regression Summary for Dependent Variable logsunival (Sheet.
Multiple Regression Re
Ready
Sheet1 in data sunwal
28°C
Partly sunny
OL C
ACCUK-
Statistica-(data survival-Analysis of Variance; DV: logsurvival (Sheet1 in data survival
Workbook
Home Edit
View Format Statistics Data Mining Graphs Tools Data
Random Values
DDE
+++
a
Copy Down
OLE
X Cut Select All
Copy Clear
Format Delete
Clipboard/Data
Move Screen
Find
Replace
Repeat
➜Go To
Find/Replace
Variables Cases
Catcher
Copy Right
Variables Cases OLE
Object Object
Insert
Fill
Standardize
Analysis of Variance; DV: logsurvival (Sheet1 in data_survival)
Sums of df Mean
Squares
P-value
Squares
56 25488 0.000000
3 064336 40.766084
0.667286 49 0.013618
3.731622
rmat
".
R
essi
mn
gre liver
ata survival
Sheet!
ata survival
a
Find
Multiple R. Effect
Regress Regress.
Sumn Residual
Total
Regre
Replace FR Rando
Repeat
Summary of Stepwise Regression, DV logsunwal
CI,VI
e
Feature
Edit
Links Dictionary
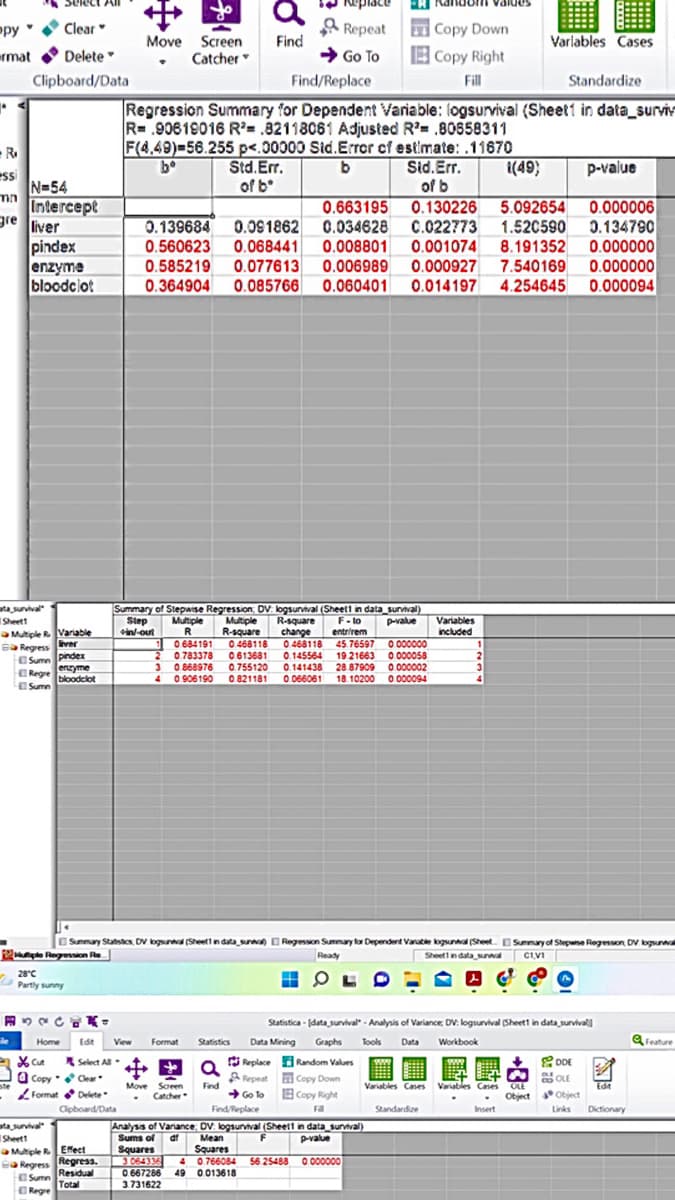
![What is the first variable to enter in the stepwise regression?
[Select]
How many variables entered in the entire process?
[Select]
What do you notice about R2 when you increase the number of variables?
[Select]](/v2/_next/image?url=https%3A%2F%2Fcontent.bartleby.com%2Fqna-images%2Fquestion%2F0bff1932-31b7-4d51-b642-e3fcc7f5386a%2F748ac347-b17b-4843-a650-ff57a97dfe76%2F0qwb9st_processed.jpeg&w=3840&q=75)
Transcribed Image Text:What is the first variable to enter in the stepwise regression?
[Select]
How many variables entered in the entire process?
[Select]
What do you notice about R2 when you increase the number of variables?
[Select]
Expert Solution
This question has been solved!
Explore an expertly crafted, step-by-step solution for a thorough understanding of key concepts.

Step by step
Solved in 2 steps

Recommended textbooks for you
MATLAB: An Introduction with Applications
Statistics
ISBN:
9781119256830
Author:
Amos Gilat
Publisher:
John Wiley & Sons Inc

Probability and Statistics for Engineering and th…
Statistics
ISBN:
9781305251809
Author:
Jay L. Devore
Publisher:
Cengage Learning

Statistics for The Behavioral Sciences (MindTap C…
Statistics
ISBN:
9781305504912
Author:
Frederick J Gravetter, Larry B. Wallnau
Publisher:
Cengage Learning
MATLAB: An Introduction with Applications
Statistics
ISBN:
9781119256830
Author:
Amos Gilat
Publisher:
John Wiley & Sons Inc
Probability and Statistics for Engineering and th…
Statistics
ISBN:
9781305251809
Author:
Jay L. Devore
Publisher:
Cengage Learning
Statistics for The Behavioral Sciences (MindTap C…
Statistics
ISBN:
9781305504912
Author:
Frederick J Gravetter, Larry B. Wallnau
Publisher:
Cengage Learning

Elementary Statistics: Picturing the World (7th E…
Statistics
ISBN:
9780134683416
Author:
Ron Larson, Betsy Farber
Publisher:
PEARSON

The Basic Practice of Statistics
Statistics
ISBN:
9781319042578
Author:
David S. Moore, William I. Notz, Michael A. Fligner
Publisher:
W. H. Freeman

Introduction to the Practice of Statistics
Statistics
ISBN:
9781319013387
Author:
David S. Moore, George P. McCabe, Bruce A. Craig
Publisher:
W. H. Freeman