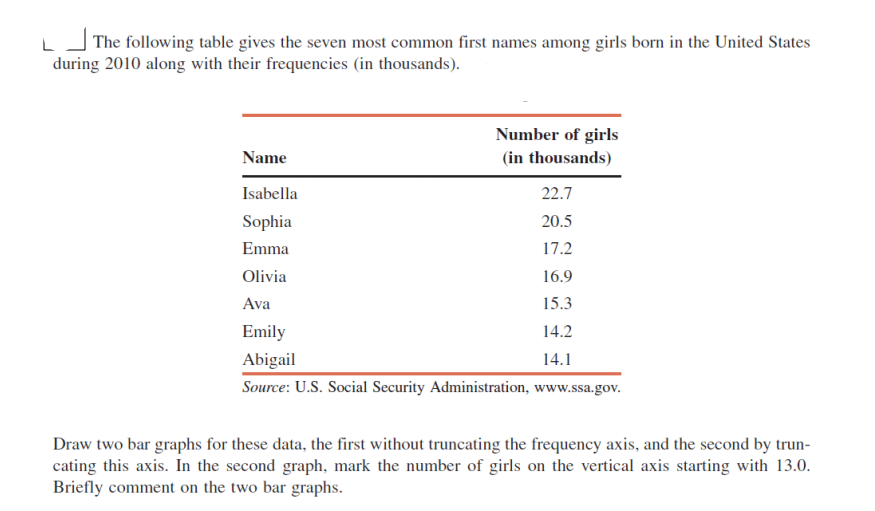
The following table gives the seven most common first names among girls born in the United States during 2010 along with their frequencies (in thousands). Number of girls (in thousands) Name Isabella 22.7 Sophia 20.5 Emma 17.2 Olivia 16.9 Ava 15.3 Emily 14.2 Abigail 14.1 Source: U.S. Social Security Administration, www.ssa.gov. Draw two bar graphs for these data, the first without truncating the frequency axis, and the second by trun- cating this axis. In the second graph, mark the number of girls on the vertical axis starting with 13.0. Briefly comment on the two bar graphs.
The following table gives the seven most common first names among girls born in the United States during 2010 along with their frequencies (in thousands). Number of girls (in thousands) Name Isabella 22.7 Sophia 20.5 Emma 17.2 Olivia 16.9 Ava 15.3 Emily 14.2 Abigail 14.1 Source: U.S. Social Security Administration, www.ssa.gov. Draw two bar graphs for these data, the first without truncating the frequency axis, and the second by trun- cating this axis. In the second graph, mark the number of girls on the vertical axis starting with 13.0. Briefly comment on the two bar graphs.

Glencoe Algebra 1, Student Edition, 9780079039897, 0079039898, 2018
18th Edition
ISBN:9780079039897
Author:Carter
Publisher:Carter
Chapter10: Statistics
Section10.6: Summarizing Categorical Data
Problem 25PPS

Related questions
Question
Draw two bar graphs for these data, the first without truncating the frequency axis, and the second by truncating this axis. In the second graph, mark the number of girls on the vertical axis starting with 13.0. Briefly comment on the two bar.
please answer step by step. Must draw graph follow question.Answer must be corrsect
Transcribed Image Text:The following table gives the seven most common first names among girls born in the United States
during 2010 along with their frequencies (in thousands).
Number of girls
Name
(in thousands)
Isabella
22.7
Sophia
20.5
Emma
17.2
Olivia
16.9
Ava
15.3
Emily
14.2
Abigail
14.1
Source: U.S. Social Security Administration, www.ssa.gov.
Draw two bar graphs for these data, the first without truncating the frequency axis, and the second by trun-
cating this axis. In the second graph, mark the number of girls on the vertical axis starting with 13.0.
Briefly comment on the two bar graphs.
Expert Solution
This question has been solved!
Explore an expertly crafted, step-by-step solution for a thorough understanding of key concepts.

This is a popular solution!

Trending now
This is a popular solution!

Step by step
Solved in 3 steps with 2 images

Knowledge Booster


Learn more about
Need a deep-dive on the concept behind this application? Look no further. Learn more about this topic, statistics and related others by exploring similar questions and additional content below.Recommended textbooks for you
Glencoe Algebra 1, Student Edition, 9780079039897…
Algebra
ISBN:
9780079039897
Author:
Carter
Publisher:
McGraw Hill

Holt Mcdougal Larson Pre-algebra: Student Edition…
Algebra
ISBN:
9780547587776
Author:
HOLT MCDOUGAL
Publisher:
HOLT MCDOUGAL

Big Ideas Math A Bridge To Success Algebra 1: Stu…
Algebra
ISBN:
9781680331141
Author:
HOUGHTON MIFFLIN HARCOURT
Publisher:
Houghton Mifflin Harcourt
Glencoe Algebra 1, Student Edition, 9780079039897…
Algebra
ISBN:
9780079039897
Author:
Carter
Publisher:
McGraw Hill
Holt Mcdougal Larson Pre-algebra: Student Edition…
Algebra
ISBN:
9780547587776
Author:
HOLT MCDOUGAL
Publisher:
HOLT MCDOUGAL
Big Ideas Math A Bridge To Success Algebra 1: Stu…
Algebra
ISBN:
9781680331141
Author:
HOUGHTON MIFFLIN HARCOURT
Publisher:
Houghton Mifflin Harcourt