The following table indicates the ages of a sample of female employees of People Plus Pty, and the corresponding monthly income of each employee (in thousands of Rands). Age In Years (x) Monthly Income (RO00s) (y) 40 43 49 49 32 36 27 31 38 41 46 42 3y completing the table given below, and then applying the relevant formulae, determine the linear regression function for this bivariate data set. y x2 ху ТОTAL If a female employee is 39 years of age, estimate her monthly income.
Q: Determine the equation of the regression line for the following data, and compute the residuals.…
A: Computation: From the table, the summary of quantities are,
Q: A U.S. state's Bureau of Economic Geology published a study on the economic impact of using carbon…
A: Let 'r' denotes the percent recovery & "j(r)" denotes the jobs created. then r : 20…
Q: estimate for a regression model fitted to a large number of paired observations is 1.75,…
A: Approximately 95% of the residuals would lie within 2 standard deviations of the mean.
Q: Years of Work Experience and number of Job Offers of 10 job-seekers were as follows: Work Exp.…
A: from regression y = a + bx y is dependent variable = no of offers a intercept b is slope x…
Q: In a simple linear regression of y on x, the following statistics are calculated from a sample of 10…
A: We first find the least square estimate of the slope.
Q: The table below shows the number of state-registered automatic weapons and the murder rate for…
A:
Q: The number of initial public offerings of stock issued in a 10-year period and the total proceeds of…
A: Step-by-step procedure to find the 95% prediction interval for the proceeds when the number of…
Q: For variables x1, x2, x3, and y satisfying the assumptions for multiple linear regression…
A: Distribution of regression parameters:
Q: Suppose that the sales of a company (Y) is regressed on advertising expenditure (x) and labor cost…
A: Here the Regression equation is provided as : sales of a company (Y) advertising expenditure (x)…
Q: 1. Show that the following relationship on the simple linear regression class notebook is true: E,…
A:
Q: A random sample of 10 drivers insured with a company and having similar auto insurance policies was…
A: Hi, thanks for the question. Since there are multiple subparts posted, we will answer only the first…
Q: A random sample of twelve students were chosen, and their midterm test score (y), as- signment score…
A: Given, Midterm Score, y Assignment Score, x1 Classes Missed, x2 85 74 76 90 85 87 94 98…
Q: For variables x1, x2, x3, and y satisfying the assumptions for multiple linear regression…
A:
Q: The number of initial public offeringe of stock issued in a 10-year period and the total proceeds of…
A: The regression equation is given as : y^=32.641x +17627.405 The prediction interval is the…
Q: below shows the numbers of newvehicle sales (in thousands) for Company 1 and Company 2 for 11 years.…
A:
Q: 2. Years of Work Experience and number of Job Offers of 10 job-seekers were as follows: Work Exp. 4…
A: Given : Data represents years of work experience and number of job offers of 10 job seekers . The…
Q: The number of initial public offerings of stock issued in a 10-year period and the total proceeds of…
A: Given Information:
Q: The number of initial public offerings of stock issued in a 10-year period and the total proceeds of…
A: Obtain the value of the standard error of estimate. The value of the standard error of estimate…
Q: Here is a bivariate data set. Find the regression equation for the response variable y. x y 55.1…
A: Regression: Regression is a technique that is used to determine relationship between two or more…
Q: Use the following model generated from backwards multiple linear regression to estimate VOzma (ml-kg…
A:
Q: The data in Table 11.17 are given for 9 patients with aplastic anemia [11]. *11.1 Fit a regression…
A: Given: Two variables, x and y where x is percentage of reticulocytes and y is number of lymphocytes.…
Q: Find out the regression coeticients of Y on X and X on Y from the following data: ΣΧ= 50 , X= 5, Σ Υ…
A:
Q: The following are data on the average weekly profits(in $1,000) of five restaurants, their seating…
A: Software procedure for regression in EXCEL. Enter the given data in EXCEL sheet. Go to Data >…
Q: The following table gives the ages of female students in school and the corresponding Body Mass…
A: The independent variable is Age. The dependent variable is BMI. The given data represents simple…
Q: A professor in a university polled a dozen colleagues about the number of professional meetings they…
A: The independent variable is the number of professional meetings they attended in the past five…
Q: (A)Determine the regression equation in y = ax + b form and write it below? (B) How many murders…
A: We want to equation of regression line in y = ax + b
Q: The number of initial public offerings of stock issued in a 10-year period and the total proceeds of…
A: Use the Excel and Perform the Regression. Followings are the Steps to perform the Regression 1) Open…
Q: The number of initial public offerings of stock issued in a 10-year period and the total proceeds…
A: Consider the table-
Q: The table below shows (lifetime) peptic ulcer rates (per 100 population), U , for various family…
A: Given that : X Y X \cdot YX⋅Y X^2X2 Y^2Y2 4000 14.2 56800 16000000 201.64 6000 13.7…
Q: The following table gives the yearly income (in thousands of dollars) of a large corporation for the…
A:
Q: For these (x,y) pairs of data points: 1,5 3,7 4,6 5,8 7,9 Compute . Compute . What is the…
A: We have given that, The independent variable X and the dependent variable y, Then, We will find…
Q: The table below shows the number of state-registered automatic weapons and the murder rate for…
A: From given data, X Y X*Y X*X 11.3 13.9 157.07 127.69 8.2 10.7 87.74 67.24 7.1 10.3 73.13…
Q: The number of initial public offerings of stock issued in a 10-year period and the total proceeds…
A: GivenData of Issues and Proceeds as shown below The mean of X and Y are calculated as shown…
Q: The following table contains data for the number of bacteria y (in millions) growing in a…
A: The data is provided for the number of bacteria y (in millions) growing in a particular medium after…
Q: The following table gives the data for the average temperature and the snow accumulation in several…
A: See the handwritten solution
Q: For variables x1, x2, x3 and y satisfying the assumptions for multiple linear regression inferences,…
A:
Q: sixth-grade teacher believes that there is a relationship between his students’ IQ scores (y) and…
A:
Q: The table below shows the number of state-registered automatic weapons and the murder rate for…
A: x¯=∑xn=37.28=4.65y¯=∑yn=63.98=7.9875
Q: The following is a partial computer output of a multiple regression analysis of a data set…
A: The provided information is: The regression equation is,SALEPRIC = 1470 + 0.814 LANDVAL + 0.820…
Q: The table below shows the number of state-registered automatic weapons and the murder rate for…
A:
Q: Consider the following population linear regression model of individual food expenditure: Y = 50 +…
A:
Q: The following table shows data on X= pressure of extracted gas (microns) and Y= extraction time…
A: Sl no X Y X2 Y2 XY y-ybar (y-ybar)2 1 40 2.5 1600 6.25 100 -259 67081 2 130 3 16900 9 390 -258.5…
Q: The following table indicates the ages of a sample of female employees of People Plus Pty, and the…
A:
Q: The number of initial public offerings of stock issued in a 10-year period and the total proceeds of…
A: Regression analysis
Q: A researcher would like to predic the dependert variable Y from the two independert variables X, and…
A: Given: N=18 α=0.01
Q: The owner of a movie theater company used multiple regression analysis to predict gross revenue (y)…
A: From the given information, The owner of a movie theater used multiple regression to predict gross…
Q: The table below shows the number of state-registered automatic weapons and the murder rate for…
A: x y xy x2 11.7 13.8 161.46 136.89 8.1 10.7 86.67 65.61 6.7 9.9 66.33 44.89 3.3 6.6…
Q: (a) Find the equation of the regression line. Ulcer rate, U(x)= . (b) Estimate the peptic ulcer…
A:
please see attached .
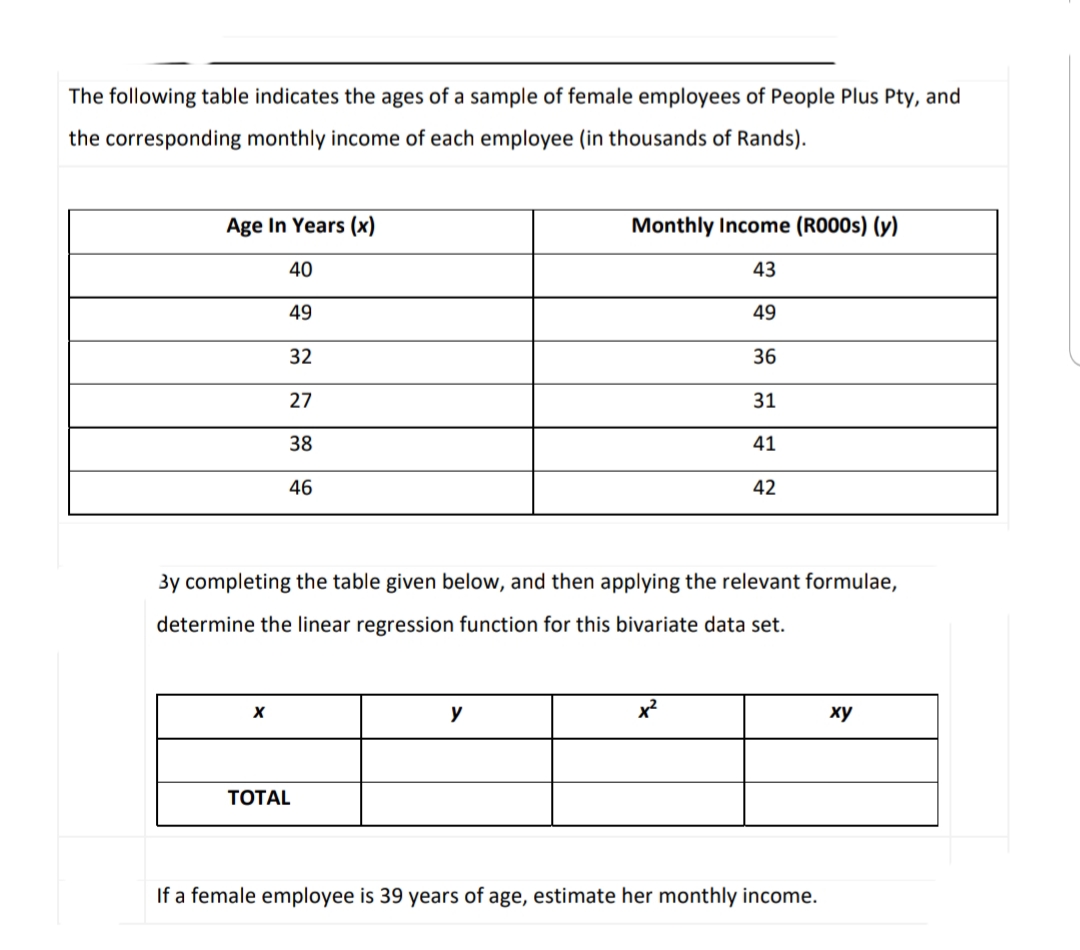
Step by step
Solved in 3 steps
- If your graphing calculator is capable of computing a least-squares sinusoidal regression model, use it to find a second model for the data. Graph this new equation along with your first model. How do they compare?The following table indicates the ages of a sample of female employees of People Plus Pty, and the corresponding monthly income of each employee (in thousands of Rands). Age In Years (x) 404932273846 Monthly Income (R000s) (y) 434936314142 By completing the table given below, and then applying the relevant formulae, determine the linear regression function for this bivariate data set. X Y X^2 XY TOTAL If a female employee is 39 years of age, estimate her monthly income.Suppose that a regional express delivery service company wants to estimate the cost of shipping a package (Y) as a function of cargo type, where cargo type includes the following possibilities: fragile, semi-fragile, and durable. Costs for 15 randomly chosen packages of approximately the same weight and same distance shipped, but of different cargo types, are provided in the file P14_16.xlsx. a. Estimate a regression equation using the given sample data, and interpret the estimated regression coefficients. b. According to the estimated regression equation, which cargo type is the most costly to ship? Which cargo type is the least costly to ship? c. How well does the estimated equation fit the given sample data? How might the fit be improved? d. Given the estimated regression equation, predict the cost of shipping a package with semi-fragile cargo.
- The following results are from data concerning the amount withdrawn from an ATM machine based on the amount of time spent at the ATM machine (SECONDS) and the gender, FEMALE (dummy variable = 1 for females and = 0 for males) and an interaction term, SECONDS*FEMALE Based on the regression results, what is the predicted amount withdrawn for a male who spends 20 at the ATM machine? (please express your answer using 1 decimal places)Suppose that researchers are interested in determining the bi-annual salary of statisticians of different levels using their years of experience and their education level (M = bachelors, P = doctorate). They fit the following model to a dataset that includes these variables and, after performing the proper steps of multiple linear regression, the following multiple linear regression model is obtained: yˆ = 42308 + 323x1 + 213x2 + 301(x1*x2) where the variables are as follows: yˆ = predicted bi−annual salary in dollars, x1 = number of years of experiencex2= {1 if the education level is a doctorate 0 if the education level is a bachelors What is the predicted bi-annual salary in dollars of an employee with 5 years of experience and a bachelor’s degree?Suppose that researchers are interested in determining the bi-annual salary of statisticians of different levels using their years of experience and their education level (M = bachelors, P = doctorate). They fit the following model to a dataset that includes these variables and, after performing the proper steps of multiple linear regression, the following multiple linear regression model is obtained: yˆ = 42308 + 323x1 + 213x2 + 301(x1*x2) where the variables are as follows: yˆ = predicted bi−annual salary in dollars, x1 = number of years of experiencex2= {1 if the education level is a doctorate 0 if the education level is a bachelors What is the predicted bi-annual starting salary of an employee with a doctorate degree? (Someone with no work experience). $ What is the predicted bi-annual starting salary of an employee with a bachelor’s degree? (Someone with no work experience). $
- The following table gives the ages of female students in school and the corresponding Body Mass index (BMI) of 8 randomly selected students.(α=0.05) Age24223032211925 BMI27283029282726 Determine whether ages and BMI are significantly related.Determine the coefficient of linear determination and Intepret.Set up a linear regression equation to predict body mass index from age of students.Predict the body mass index of student who has the age of 26 years.It is required to use the data given in the table to estimate the parameters of the simple linear regression equation by any of the estimation methods:Suppose the regression in Equation is estimated using LoSTR andLoEL in place of HiSTR and HiEL, where LoSTR = 1 - HiSTR is anindicator for a low-class-size district and LoEL = 1 - HiEL is an indicatorfor a district with a low percentage of English learners. What are thevalues of the estimated regression coefficients?
- The following table gives the data for the average temperature and the snow accumulation in several small towns for a single month. Determine the equation of the regression line, yˆ=b0+b1x�^=�0+�1�. Round the slope and y-intercept to the nearest thousandth. Then determine if the regression equation is appropriate for making predictions at the 0.050.05 level of significance. Critical Values of the Pearson Correlation Coefficient Average Temperatures and Snow Accumulations Average Temperature (℉℉) 3939 2525 1515 4242 4242 2424 3232 2020 3030 3737 Snow Accumulation (in.in.) 66 1515 2929 66 1414 2626 2323 1212 1616 77 Copy Data Regression equation: yˆ=�^= Is the equation appropriate? YesThe data in Table 11.17 are given for 9 patients with aplastic anemia [11]. 11.6 Test for the statistical significance of the regression line using the t test.For variables x1, x2, x3 and y satisfying the assumptions for multiple linear regression inferences, the population regression equation is y = 27 – 4.7x1 + 2.3x2 + 5.8 x3. For samples of size 20 and given values of the predictor variables, the distribution of the estimates of β1 for all possible sample regression planes is a _________ distribution with mean _________ and standard deviation _______.