The following table shows data on X= pressure of extracted gas (microns) and Y= extraction time (min). Assume Y is normally distributed with constant variance o? for each x. 40 130 155 160 260 |275 | 325 370 | 420 | 480 2.5 3.0 3.1 3.3 3.7 4.1 4.3 4.8 5.0 5.4 1. Construct a scatter plot of the data. Does it support the use of the simple linear regression model? Explain. 2. Calculate B, and ß, (the point estimates of the slope and intercept of the regression line), and write down the estimated regression line equation of Y on X. ( 3. Calculate a point estimate of the standard deviation o of Y, then calculate and interpret the coefficient of determination r2.
The following table shows data on X= pressure of extracted gas (microns) and Y= extraction time (min). Assume Y is normally distributed with constant variance o? for each x. 40 130 155 160 260 |275 | 325 370 | 420 | 480 2.5 3.0 3.1 3.3 3.7 4.1 4.3 4.8 5.0 5.4 1. Construct a scatter plot of the data. Does it support the use of the simple linear regression model? Explain. 2. Calculate B, and ß, (the point estimates of the slope and intercept of the regression line), and write down the estimated regression line equation of Y on X. ( 3. Calculate a point estimate of the standard deviation o of Y, then calculate and interpret the coefficient of determination r2.

Glencoe Algebra 1, Student Edition, 9780079039897, 0079039898, 2018
18th Edition
ISBN:9780079039897
Author:Carter
Publisher:Carter
Chapter10: Statistics
Section10.1: Measures Of Center
Problem 9PPS

Related questions
Topic Video
Question
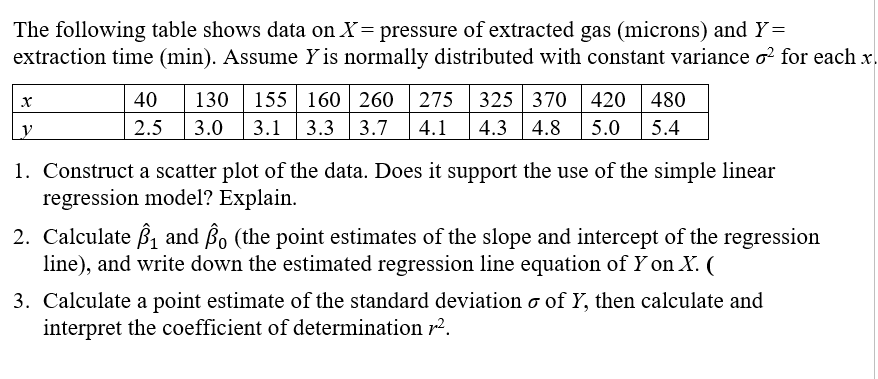
Transcribed Image Text:The following table shows data on X= pressure of extracted gas (microns) and Y=
extraction time (min). Assume Y is normally distributed with constant variance o? for each x.
155 160 260 275 325 370 420
3.1 3.3 3.7
40
130
480
2.5
3.0
4.1
4.3 4.8
5.0
5.4
1. Construct a scatter plot of the data. Does it support the use of the simple linear
regression model? Explain.
2. Calculate B, and Bo (the point estimates of the slope and intercept of the regression
line), and write down the estimated regression line equation of Y on X. (
3. Calculate a point estimate of the standard deviation o of Y, then calculate and
interpret the coefficient of determination r2.
Expert Solution
This question has been solved!
Explore an expertly crafted, step-by-step solution for a thorough understanding of key concepts.

This is a popular solution!

Trending now
This is a popular solution!

Step by step
Solved in 5 steps with 4 images

Knowledge Booster


Learn more about
Need a deep-dive on the concept behind this application? Look no further. Learn more about this topic, statistics and related others by exploring similar questions and additional content below.Recommended textbooks for you
Glencoe Algebra 1, Student Edition, 9780079039897…
Algebra
ISBN:
9780079039897
Author:
Carter
Publisher:
McGraw Hill
Glencoe Algebra 1, Student Edition, 9780079039897…
Algebra
ISBN:
9780079039897
Author:
Carter
Publisher:
McGraw Hill