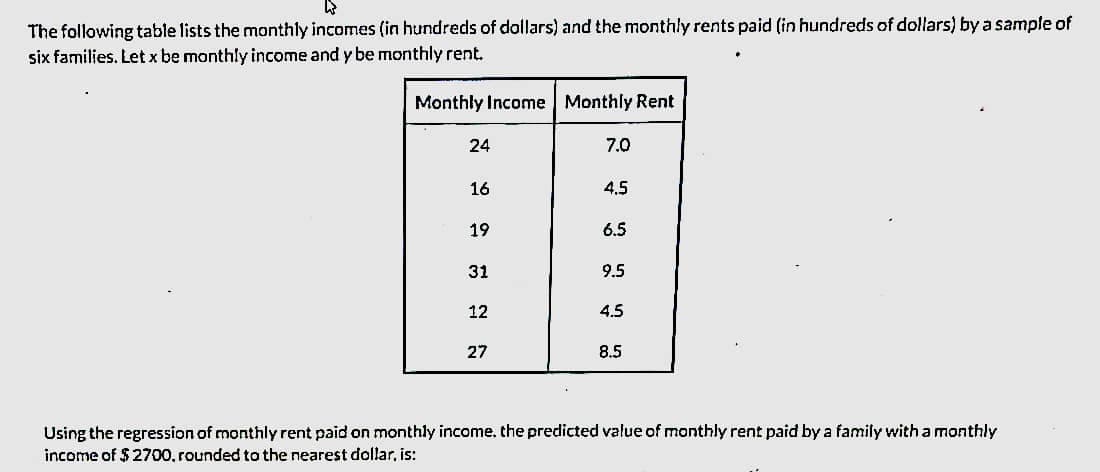
The following table lists the monthly incomes (in hundreds of dollars) and the monthly rents paid (in hundreds of dollars) by a sample of six families. Let x be monthly income and y be monthly rent. Monthly Income Monthly Rent 24 7.0 16 4.5 19 6.5 31 9.5 12 4.5 27 8.5 Using the regression of monthly rent paid on monthly income. the predicted value of monthly rent paid by a family with a monthly income of $2700. rounded to the nearest dollar, is:


Q: (a) what are the null hypothesis H, and the alternative hypothesis H, that should be used for the…
A: Test is that whether the average is greater than 40 minutes. The type I error is defined as…
Q: Did Clayton State Students gain weight, on average, during the COVID-19 quarantine? You wonder if…
A: Given that x̄ = 168.9 , μ = 163.7 , s = 13.8 , n = 43 Note: According to bartleby experts question…
Q: Ross thinks that the weight of a person can tell you how smart they are. To find out Ross gathered…
A:
Q: Directions: Determine whether each statement is a null or an alternative hypothesis. Explain your…
A: Null hypothesis: The amount of radiation a desktop computer emits has no difference to that of a…
Q: The following table lists the monthly incomes (in hundreds of dollars) and the monthly rents paid…
A: X: 24,16,19,31,11,27 Y: 7,4.5,6.5,11.5,4.5,8.5
Q: You are interested in finding a 99% confidence interval for the average commute that non-residential…
A: Given that Observation: XX X^2X2 1 19 361 2 27 729 3 16 256 4 23 529 5 12 144 6 26…
Q: uestion Review(41c): A researcher was interested in the effect of outdoor acitivity on mood.She…
A: Regression Analysis: A researcher uses a regression analysis model to predict the dependent or…
Q: The heights of a group of boys are normally distributed with a mean of 54 inches and a standard…
A:
Q: A certain early response pregnancy test claims to be able to detect the pregnancy hormone in 76% of…
A: Let p be the proportion of women saw a positive test result on their pregnancy test. Given that p =…
Q: 44. A regression analysis yields the line ŷ = 32 + 0.4x. One of the subjects, Racheal, has x = 60…
A: Comment: As per the our company guidelines we are supposed to answer only one question. Kindly…
Q: 2. An investment consultation firm claims that it will increase the returns on its clients'…
A: Given that Sample size n =50 Sample mean =18.5 Standard deviation =0.5
Q: A grocery store manager did a study to look at the relationship between the am customers spend in…
A: The independent variable is Time. The dependent variable is Money. We have to do correlation and…
Q: Salary Mean 34096.3 Standard Error 1570.314564 Median 36705.5 Mode #N/A Standard Deviation…
A: Central tendency is a descriptive statistics.
Q: Find a 95% confidence interval for H given that x = 75.8, s = 19, n = 10. %3|
A:
Q: The daily sales at a convenience store produce a distribution that is approximately normal with a…
A:
Q: 3. The table below gives the populations of four districts A, B, C, and D, among which a total of 2…
A:
Q: (a) If researchers decide on a 4.5% margin of error for a 95% confidence interval. What sample size…
A: Here given, Before conducting a study it is often a good idea to decide on the necessary sample…
Q: 4. A company is interested in evaluating its current inspection procedure for shipments of 50…
A:
Q: If you wanted information about a population, it could be impossible to ask everyone. One way to…
A: In the given problem we have to answer, Why might it be important to small subgroups of populations…
Q: Part variability is critical in the manufacturing of ball bearings. Large variances in the size of…
A: The following information has been given: The sample size is n=15 The sample standard deviation is S…
Q: Consider the following hypothesis test: H0:μ=20 H1:μ≠20 A sample of 200 items will be taken and the…
A:
Q: P(B) =0.45 P(aB) =0.25 %3D What is the linkage disequilibrium between these traits? Round your…
A: *Answer:
Q: A magazine subscription service is having a contest in which the prize is $40,000. If the company…
A: Solution-: A magazine subscription service is having a contest in which the prize is $40,000. If the…
Q: Consider a regression study involving a dependent variable y, a quantitative independent variable…
A: It is given that the number of dependent variables is 1.
Q: Complete parts (a) and (b) below. The number of dogs per household in a small town Dogs 1 2 3 4…
A: Dogs(X) 0 1 2 3 4 5 P(x) 0.632 0.232 0.088 0.026 0.014 0.008
Q: A CNN/Time poll conducted in the United States October 18-20, 2006, asked, "Do you favor or oppose…
A: Given: n=1771,p^=22.2%=0.2220,MOE=1.33%=0.0133 We find level of confidence were they use?
Q: II. Determine whether the events are mutually exclusive, non-mutually exclusive, independent, or…
A:
Q: The owner ofr Showtime Movie Theaters, Inc., used multiple regression analysis to predict gross…
A:
Q: Find the equation of the multiple regression plane of Z on X and Y from the following data. X : 30…
A: Step-by-step procedure to find the multiple regression plane of Z on X and Y using Excel: In Excel…
Q: minutes. The average time to receive the order for the 20 customers was 3.5 minutes with a standard…
A: Given that Sample size n =20 Sample mean =3.5 Sample standard deviation =0.75
Q: At a large industrial plant, employees were classified according to age and given a leadership exam.…
A: Hypothesis test are used to determine whether there is any significancy exist between the sample and…
Q: Let X1, X2,..., Xm be a random sample from a population r.v. X ~ N(0,0²), with o to be known. Show…
A: Given X~N(θ,σ2)
Q: In a Pew Research poll, 287 out of 522 randomly selected U.S. men were able to identify Egypt when…
A: Given that X1=287 , X2=233 , n1=522 ,n2=520
Q: Find a 0.90 confidence interval for the mean claim payment. (Round your answers to two decimal…
A: It is given that Sample size n = 360 Sample mean M = 1600 Population SD = 232 The critical values of…
Q: The survey of 523 students showed that 141 first year engineering students were willing to enroll…
A:
Q: The table shows election data for a hypothetical state in two different years (before and after…
A:
Q: You want to retire at age 65. You decide to make a deposit to yourself at the end of each year into…
A:
Q: 4. Sketch the graph of the following p.d.f. Also, find and sketch the graphs of the distribution…
A:
Q: The daily sales at a convenience store produce a distribution that is approximately normal with a…
A:
Q: Identify test statistic Identify Z value Reject or accept hypothesis
A:
Q: Has the proportion of Americans that are "20-somethings" decreased? According to the US Census…
A: Solution-: Given: x=65,n=500,P0=0.151,α=0.10 We want to determine, (e) p-value=? (f) At α=0.10…
Q: Uber and Bolt are two competing transport system that facilitate local transport in South Africa. It…
A:
Q: In a simple random sample of size 60, there were 39 individuals in the category of interest. Part:…
A: From the provided information, Sample size (n) = 60 From which 39 individuals in the category of…
Q: (a) Find the probability that the number that prefer to purchase electronics online is exactly five.…
A: We have given that the 75% of consumers prefer to purchase electronics online. Here, p = 75% = 0.75…
Q: Data was collected for 300 fish from the North Atlantic. The length of the fish (in mm) is…
A: Given that Frequency distribution table Lengths (mm) Frequency 140 - 141 1 142 -…
Q: Point Estimates for EAI Employees. In section 7.3, we showed how a simple random sample of 30 EAI…
A:
Q: A fiber spinning process produces a fiber whose strength is normally distributed with average of…
A: Given that X~Normal(μ= 78.9 , σ2 = 30 ) μ=78.9 , σ=√30=5.48 Minimum acceptable resistance=65.7…
Q: Suppose IQ scores were obtained for 20 randomly selected sets of twins. The 20 pairs of measurements…
A:
Q: The accompanying table gives amounts of arsenic in samples of brown rice from three different…
A: The table shows the amounts of arsenic in samples of brown rice from three different states.
Q: Karen and Wayne need to buy a refrigerator because theirs just broke. Unfortunately, their savings…
A:
Complete solution please

Step by step
Solved in 2 steps with 3 images

- Olympic Pole Vault The graph in Figure 7 indicates that in recent years the winning Olympic men’s pole vault height has fallen below the value predicted by the regression line in Example 2. This might have occurred because when the pole vault was a new event there was much room for improvement in vaulters’ performances, whereas now even the best training can produce only incremental advances. Let’s see whether concentrating on more recent results gives a better predictor of future records. (a) Use the data in Table 2 (page 176) to complete the table of winning pole vault heights shown in the margin. (Note that we are using x=0 to correspond to the year 1972, where this restricted data set begins.) (b) Find the regression line for the data in part ‚(a). (c) Plot the data and the regression line on the same axes. Does the regression line seem to provide a good model for the data? (d) What does the regression line predict as the winning pole vault height for the 2012 Olympics? Compare this predicted value to the actual 2012 winning height of 5.97 m, as described on page 177. Has this new regression line provided a better prediction than the line in Example 2?The following data shows the percent of females 18 years old or older who were overweight in the number of years indicated, judging on the basis of BMI. Year, Percent Obese 3 , 23.3 4, 23.7 5, 24.3 6, 25.6 7, 25.2 8, 27.6 9, 26.8 Using regression equation, predict the percent of overweight females in year 15.The table below shows the average weekly wages (in dollars) for state government employees and federal government employees for 10 years. Construct and interpret a 95% prediction interval for the average weekly wages of federal government employees when the average weekly wages of state government employees is $841. The equation of the regression line is ModifyingAbove .y=1.403x+9.259. Wages (state), x 724 747 800 803 839 897 901 939 951 956 Wages (federal), y 1,035 1,060 1,111 1,144 1,190 1,245 1,276 1,306 1,332 1,396 Construct and interpret a 95% prediction interval for the average weekly wages of federal government employees when the average weekly wages of state government employees is $841. Select the correct choice below and fill in the answer boxes to complete your choice. (Round to the nearest cent as needed.) A. There is a 95% chance that the predicted average weekly wages of federal government…
- The following table gives information on the amount of sugar (in grams) and the calorie count in one serving of a sample of varieties of Kellogg's cereal. Find the predictive regression equation of the number of calories on the amount of sugar. Sugar (grams) 6 15 12 11 8 6 7 4 9 14 20 13 3 Calories 120 200 150 110 120 80 190 120 120 190 190 120 120Below is a sample of men’s shoe size and height. At 5% level of significance, is there a relationship between men’s shoe size and their height? Shoe size (x) Men's Heights (in inches), y 10 70 10.5 71 9.5 70 11 72 12 74 8.5 66 9 68.5 13 76 10.5 71.5 10.5 70.5 10 72 9.5 70 10 71 10.5 69.5 11 71.5 12 73.5 Leave your answer in 3 decimal places The regression equation: y = + ()xA specialist in hospital administration stated that no. of employees in a hospital can be estimated by counting the no. of beds in the hospital .A health care researcher decided to develop a regression model in an attempt to predict the number of employees of a hospital by the no. of beds . 12 hospitals were surveyed and obtained following data. No of Beds. Employees 23 69 29 95 29 102 35 118 42 126 46 125 50 138 54 178 64 156 66 184 76 176 78 225 After obtaining the regression model and interpret it accordingly based on your understanding. Explain the…
- The following table displays the mathematics test scores for a random sample ofcollege students, along with their final SY16C grades.a. Fit the regression line y=a+bx to the data and interpret the results.b. Use the regression equation to determine the SY16C grade for a college student whoscored 60 on their achievement test. What would their SY16C gradebe? Mathematics test(x) SY16C grades(y)1 39 652 43 783 21 524 64 825 57 926 47 897 28 738 75…Using the regression line attached. Based on only the above plot, one can conclude: a) height causes an increase in weight b) weight causes an increase in height c) taller people are more likely to weigh more than shorter people, at least in the sample on which this data is based d) a statistically significant predictive relationship between height and weight e) c and dThe following data shows the dexterity test scores of five assembly-line employees of Dimples Company Limited and their respective hourly productivity.Employee Score on dexterity test (?) Ali 12Kofi 14Kwesi 17Abudu 16Nana 11Units produced in an hour (?) 55636770 51You are required to(i) Write the regression equation(ii) Interpret the regression equation(iii) Calculate the Pearson’s Product Moment Correlation Coefficient.(iv) Interpret the correlation coefficient (v) Suppose the dexterity test score is 13, what would be the units produced in an hour? (vi) Clearly explain (in detail) the difference between regression analysis and correlation analysis.
- The following data on x=soil depth and y=percentage of montmorillonite in the soil were analyzed from samples taken in Belize X 40 50 60 70 80 90 100 Y 58 34 32 30 28 27 22 Draw the scatterplot Compute and draw the least square regression line. Compute the residual and construct a residual plot. Are there any unusual features of this plot?The following table lists the monthly incomes (in hundreds of dollars) and the monthly rents paid (in hundreds of dollars) by a sample of six families. Monthly Income Monthly Rent 24 7.0 16 4.5 19 6.5 31 11.6 10 4.5 27 8.5 4. The null hypothesis is that the slope of the population regression line of monthly rent on monthly income is zero and the alternative hypothesis is that the slope of this population regression line is greater than zero. The significance level is 1%. By hand, test whether the slope of the monthly income is greater than zero using the CV approach, including identifying the reject/non reject regions, etcThe following data is a regression model where the U.S. Department of Transportation has tried to relate the rate of fatal traffic accidents (per 1000 licenses) to the percentage of motorists under the age of 21. Data has been collected for 42 major cities in the United States. SUMMARY OUTPUT Regression Statistics Multiple R 0.83938748 R Square 0.70457134 Adjusted R Square 0.69718562 Standard Error 0.58935028 Observations 42 ANOVA df SS MS F Regression 1 33.13441764 33.1344 95.3964 Residual 40 13.89335048 0.34733 Total 41 47.02776812 Coefficients Standard Error t Stat P-value Intercept -1.5974138 0.371671454 -4.2979 0.00010 Percent Under 21 0.28705317 0.029389769 9.76711 3.79E-9…
